
Blog / How Predictive Analytics Handles Seasonality
How Predictive Analytics Handles Seasonality
Predictive analytics uses historical data to improve revenue forecasting by identifying patterns like seasonality - predictable changes influenced by events such as holidays or weather. Ignoring these patterns can lead to costly mistakes like overstocking or missed sales opportunities. By factoring in seasonality, businesses can reduce forecasting errors by 10–15% and grow 19% faster than relying on intuition.
Key Techniques for Managing Seasonality:
- Time-Series Decomposition: Breaks data into trend, seasonal, and irregular components.
- SARIMA: Captures short- and long-term seasonal patterns.
- Regression Models: Incorporates holidays or promotions as predictors.
- Machine Learning: Handles non-linear, complex seasonal cycles.
Benefits:
- Improved inventory management (15% cost reduction).
- More accurate staffing and resource planning.
- Better alignment with demand during high-impact events like Ramadan or Eid.
Practical Steps:
- Collect 2–3 years of consistent data.
- Identify patterns using tools like ACF or STL decomposition.
- Add external factors (holidays, weather) for precise forecasts.
- Validate models using metrics like MAPE and RMSE.
Predictive analytics replaces guesswork with data-driven decisions, helping UAE businesses thrive in dynamic markets.
Forecasting with trends and seasonality (4): Linear regression forecasts
Main Techniques for Handling Seasonality in Predictive Analytics
Now that we've established how crucial seasonality is for accurate revenue forecasting, let’s dive into the key techniques used to understand and model these patterns. Predictive analytics relies on methods that separate seasonal patterns from broader business trends to deliver more precise insights.
Time-Series Decomposition
This method breaks down data into its core components to uncover recurring cycles. Time-series decomposition separates data into three parts: trend (Tₜ), seasonal (Sₜ), and irregular components (Iₜ). This approach helps distinguish calendar-based fluctuations from the underlying trends.
There are two main models here:
- Additive Model: Used when seasonal effects remain constant, expressed as Yₜ = Tₜ + Sₜ + Iₜ.
- Multiplicative Model: Applied when seasonal effects vary with the trend, expressed as Yₜ = Tₜ × Sₜ × Iₜ.
Advanced tools like STL decomposition use locally weighted regression, making it effective for handling outliers and adapting to changing seasonal patterns. Meanwhile, X-13 ARIMA, developed by the U.S. Census Bureau, combines ARIMA modelling with iterative seasonal adjustment filters, perfect for managing intricate seasonal structures. For businesses dealing with overlapping cycles - like weekly and monthly patterns - TBATS employs trigonometric representations (Fourier series) to model these complexities.
Another powerful tool, SARIMA (Seasonal ARIMA), extends the standard ARIMA model by including seasonal autoregressive (P), differencing (D), and moving average (Q) terms. This allows it to capture both short-term fluctuations and long-term seasonal cycles.
"SARIMA is particularly valuable when dealing with time series data that exhibits clear seasonal patterns... leading to more accurate forecasts and better understanding of the underlying data structure." - Michael Brenndoerfer
Regression-Based Approaches
Regression models take a different route by incorporating seasonality as a predictor variable. These models often use seasonal dummy variables or external factors - like holidays, marketing campaigns, or promotions - to explain revenue variations. This method helps businesses identify which factors drive seasonal changes while maintaining the overall pattern.
For example, retailers working with shorter datasets (spanning 56 to 104 weeks) find this approach highly effective. Advanced techniques, such as Oracle's "Sales & Promo" method, go a step further by using Decision Trees or Generalised Linear Models to measure the impact of promotions against baseline seasonality.
One of the biggest advantages of regression-based methods is their transparency. The coefficients in these models clearly show how much each seasonal driver - like Ramadan, summer holidays, or year-end sales - contributes to revenue shifts. This makes them especially useful for presenting forecasts to stakeholders. These methods complement decomposition techniques by quantifying the influence of specific seasonal factors.
Machine Learning and Neural Network Models
Machine learning approaches, including Neural Networks, Random Forests, and XGBoost, are designed to handle more complex and non-linear seasonal patterns. Unlike traditional methods, these models don’t require strict assumptions about data structure or stationarity, making them ideal for irregular or evolving seasonal cycles.
"Machine learning models can handle nonlinear relationships and capture long-term dependencies, making them suitable for complex time series analysis." - Peter Wainaina, Software Engineer and Data Scientist
These models excel when dealing with large, multivariate datasets that include external variables like weather, promotions, or economic trends. However, their flexibility comes at a cost: they often lack the interpretability of traditional methods, which can be a disadvantage when businesses need to justify their forecasts to stakeholders. Striking the right balance between accuracy and transparency is key when deploying these advanced tools.
| Method | Best Use Case | Key Characteristic |
|---|---|---|
| STL Decomposition | Handling outliers and changing patterns | Uses locally weighted regression for flexibility |
| X-13 ARIMA | Complex seasonal structures | Combines ARIMA modelling with iterative seasonal adjustment filters |
| TBATS | Multiple or overlapping seasonalities | Utilises trigonometric representations (Fourier series) to model complex cycles |
| Exponential Smoothing | Short-term forecasting | Gives more weight to recent data for better accuracy |
| SARIMA | Clear, repeating seasonal cycles | Captures both short-term and long-term seasonal trends |
Steps for Preparing Data for Seasonal Forecasting
Turning raw data into reliable seasonal forecasts requires careful preparation. Without properly cleaned and structured data, even the best forecasting models can falter. The process can be broken down into three essential stages that help transform raw numbers into actionable seasonal insights.
Collecting and Analysing Historical Data
Start by gathering 2–3 years' worth of data (24–36 data points) to establish a solid baseline for seasonal cycles. This timeframe is essential to distinguish real trends from random variations. Ensure the data is collected at consistent intervals - whether daily, weekly, or monthly.
Next, visualise the raw data to uncover patterns like recurring peaks, troughs, and trends. Tools such as seasonal heatmaps and subseries plots are especially helpful for identifying differences across periods, for instance, comparing Ramadan with summer months. For a deeper dive, use the Autocorrelation Function (ACF) to identify periodicity; recurring peaks at specific lag multiples (like 12 for monthly data) confirm seasonality. Additionally, techniques like FFT can pinpoint recurring frequency components.
Before moving to modelling, handle missing values through interpolation or Kalman filters, and address outliers that could skew the results. Use the Augmented Dickey-Fuller (ADF) test to check for stationarity and ensure your data is stable for forecasting. Studies show that robust seasonal adjustments can reduce inventory costs by up to 15% and improve service levels by 10%.
Once the historical data is ready, consider incorporating external influences to refine your forecasts.
Adding External and Cultural Factors
Incorporating external drivers, especially those relevant to the UAE market, can significantly enhance forecasting accuracy. For example, create seasonal indicators using one-hot encoding to represent specific dates such as Eid al-Fitr, National Day, or White Friday. These indicators act as binary switches, allowing the model to adjust for the unique impact of these events.
For annual seasonality, Fourier features - sine and cosine curves - are a powerful way to represent patterns with fewer variables, reducing the risk of overfitting. Additionally, causal modelling can improve accuracy by factoring in external influences like weather, economic conditions, or pricing changes. For instance, in cities like Dubai or Abu Dhabi, incorporating traffic patterns and weather conditions can help address last-mile delivery challenges and refine demand forecasts.
"A slight miscalculation in demand during high-impact events like Eid al-Fitr or back-to-school season can lead to serious revenue losses or excessive markdowns." - Omniful
To ensure your model adapts to future events, create a feature table that includes details such as upcoming holidays, weather forecasts, and planned promotions. This allows your model to go beyond learning from historical data and adjust for known future variables.
After enriching your dataset, it's crucial to validate its quality to avoid errors in forecasting.
Validating Data Quality and Accuracy
Data quality issues are responsible for about 62% of forecasting errors in B2B environments. Time-series data can be messy, and failing to clean it properly can lead to biased outcomes and hidden trends. After making seasonal adjustments, validate residuals using the Ljung-Box test to ensure there’s no autocorrelation left. Residuals should resemble "white noise" - any remaining structure could indicate that the model has missed an important signal.
For retail demand forecasting, prioritise point-of-sale (POS) data over customer orders, as POS data provides a more accurate reflection of actual consumer demand and seasonality. Additionally, monitor error metrics like Mean Absolute Percentage Error (MAPE) and Root Mean Squared Error (RMSE) on a rolling basis. These metrics can help detect when accuracy starts to drop, allowing for timely adjustments. Companies that leverage data-driven time series forecasting often experience 19% faster growth compared to those relying on intuition alone.
| Validation Step | Tool/Method | Purpose |
|---|---|---|
| Stationarity Check | Augmented Dickey-Fuller (ADF) Test | Ensures mean and variance remain consistent over time |
| Residual Validation | Ljung-Box Test / ACF Plots | Confirms no residual seasonality or autocorrelation |
| Outlier Handling | STL Robustness Iterations | Prevents extreme values from distorting the trend |
| Accuracy Assessment | Cross-Validation (n_splits) | Compares predictions against withheld historical data |
sbb-itb-058f46d
Benefits of Predictive Analytics Over Traditional Forecasting
Predictive Analytics vs Traditional Forecasting: Key Performance Differences
Traditional forecasting methods - often based on spreadsheets and simple moving averages - fall short when dealing with the complexities of today's seasonal patterns. Predictive analytics takes a different approach, offering the ability to handle intricate seasonal cycles. This is particularly crucial in the UAE's fast-changing market landscape.
Comparison Table: Predictive Analytics vs. Traditional Forecasting
Here's a side-by-side look at how predictive analytics outperforms traditional forecasting in key areas like seasonality, accuracy, and scalability:
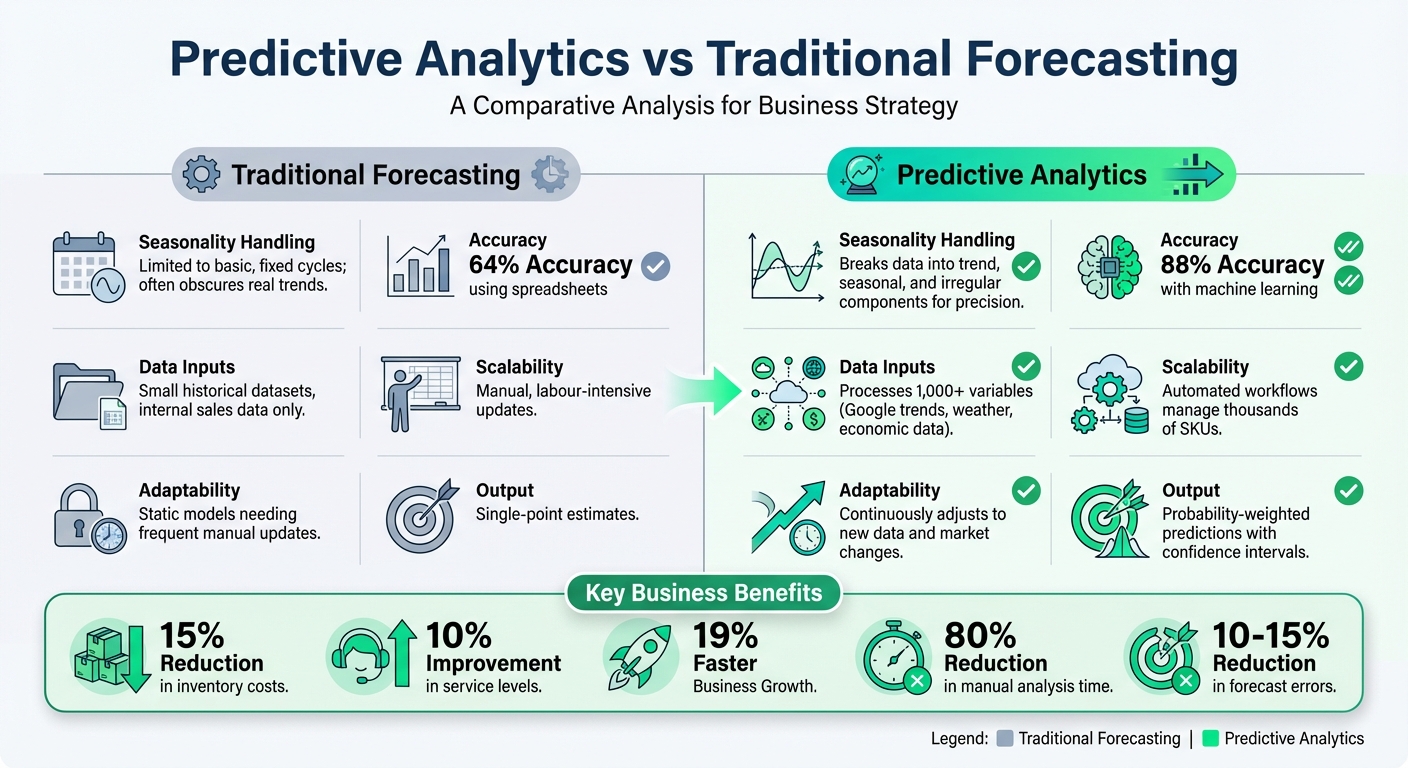
| Feature | Traditional Forecasting | Predictive Analytics |
|---|---|---|
| Seasonality Handling | Limited to basic, fixed cycles; often obscures real trends | Breaks data into trend, seasonal, and irregular components for precision |
| Accuracy | ~64% accuracy using spreadsheets | ~88% accuracy with machine learning, improving forecasts by isolating seasonal noise |
| Data Inputs | Small historical datasets, internal sales data | Processes 1,000+ variables, including Google trends, weather, and economic data |
| Scalability | Manual, labour-intensive updates | Automated workflows manage thousands of SKUs with ease |
| Adaptability | Static models needing frequent manual updates | Continuously adjusts to new data and market changes |
| Output | Single-point estimates | Probability-weighted predictions with confidence intervals |
Improved Accuracy and Scalability
Predictive analytics delivers a leap forward in both accuracy and operational efficiency, making it a game-changer for businesses.
Machine learning models used in predictive analytics achieve an accuracy rate of 88%, compared to just 64% for traditional spreadsheet methods. This higher precision translates into better inventory management and revenue optimisation during high-demand periods like Ramadan or White Friday. The ability to handle multiple seasonal cycles simultaneously - using techniques such as TBATS and SARIMA - sets predictive models apart. These methods can process weekly and yearly patterns at the same time, while traditional approaches struggle to manage even one. They also uncover complex relationships and adapt to structural changes in the market that simpler models often overlook.
"A traditional sales forecast delivers a number. Predictive analytics explains how likely that number is to occur and why." - CaptivateIQ
Scalability is another major advantage. Predictive analytics automates the processing of thousands of SKUs, cutting manual analysis time by up to 80%. By 2028, it's estimated that 15% of daily business decisions in the UAE will rely on AI-driven forecasting, reflecting growing trust in these systems. For a dynamic market like the UAE, where rapid, data-driven decisions are essential, this efficiency is invaluable.
The financial benefits are just as compelling. Companies using advanced forecasting methods see a 15% reduction in inventory costs and a 10% boost in service levels. Additionally, businesses leveraging time series forecasting grow 19% faster than those sticking to traditional methods or intuition. These gains come from predictive analytics' ability to prioritise recent data, enabling forecasts to adapt quickly to market shifts - something simple moving averages can't achieve.
For UAE businesses looking to stay ahead in a competitive environment, transitioning to predictive analytics offers clear advantages. At Wick, we use these advanced techniques to help local companies navigate complex seasonal patterns and achieve sustainable growth.
Practical Applications of Predictive Analytics in Seasonality
Adding Seasonality Metrics in Forecasting Tools
To make predictive models more accurate, businesses can integrate seasonality metrics that help algorithms detect recurring patterns. For instance, a "Quarter of Year" metric assigns values from 1 to 4 to each quarter, effectively capturing annual trends like a summer slowdown in Q3. Another approach, the "Quarter Index", uses sequential values (e.g., Q2 2022 = 2, Q3 2024 = 11) to reflect ongoing growth trends over time.
For event-driven sales spikes, a "Holiday Impact" binary feature works as an on/off indicator. Retailers, for example, can mark culturally important periods like Ramadan, Eid, or White Friday with a value of 1, while regular trading days are assigned 0. Additionally, businesses can use date-based calculations to create "Quarter End" helper variables. A formula like thisQuarter() + 2 months can assign higher sales quotas toward the end of each quarter, mirroring real-world trends where deals often finalise as the quarter closes.
By integrating these metrics into predictive models, businesses can achieve more precise and reliable forecasts.
Quarterly Revenue Predictions: Hypothetical Case Study
Let’s consider a hypothetical example of a Dubai-based fashion retailer analysing three years of historical sales data. Using STL decomposition, they identify a steady 3% annual growth, with noticeable dips in Q1 and spikes in Q4.
Building on these findings, the retailer creates a SARIMA model that incorporates the "Quarter of Year" metric and the "Holiday Impact" feature to account for seasonal changes. Training the model on 100,000 rows of transaction data takes about 400 seconds on a standard virtual warehouse. The resulting forecast highlights a revenue boost in Q4, showcasing how seasonality metrics improve predictive accuracy. By referencing "One Year Ago" data points, the forecast remains consistent with seasonal trends from the previous year.
This approach demonstrates how businesses can use seasonality insights to refine their forecasting strategies and make data-driven decisions.
Conclusion and Key Takeaways
Summary of Key Benefits
Integrating seasonality into predictive analytics is reshaping how businesses in the UAE forecast revenue. By isolating seasonal trends, companies can cut forecast errors by 10–15%, allowing them to better understand true growth patterns. This level of accuracy directly impacts operations: businesses often experience a 15% drop in inventory costs by aligning stock levels with demand predictions, while service levels improve by approximately 10%.
The advantages go beyond cost management. Predictive analytics helps optimise resource allocation, such as workforce scheduling during high-demand periods like Ramadan and Eid. Financially, it also supports smarter strategic planning. By identifying recurring revenue patterns, businesses can establish predictable cash flow, enabling confident budgeting and long-term investments.
Moreover, companies using time-series forecasting methods grow 19% faster than those relying on subjective predictions. This edge comes from their ability to execute well-timed marketing campaigns tied to cultural events and seasonal shopping peaks, while also maintaining a clear view of their underlying business performance separate from seasonal fluctuations. This approach empowers UAE businesses to align their strategies with both cultural and market dynamics.
Next Steps for Implementing Predictive Analytics
To tap into these benefits, businesses should take a structured approach to implementing predictive analytics.
First, invest in robust data infrastructure capable of collecting 2–3 years of historical sales data to identify seasonal trends. Use a combination of statistical methods and machine learning models to capture the full spectrum of seasonal variations. For example, blending techniques like SARIMA with machine learning models ensures both linear trends and complex interactions are accounted for.
For businesses in the UAE looking to make the leap, Wick provides data analytics services that incorporate seasonal forecasting into broader digital marketing strategies. Automating seasonal adjustments in data pipelines and validating forecasts with metrics such as MAPE and RMSE ensures accuracy as new data becomes available. This proactive approach replaces guesswork with informed, strategic decision-making.
FAQs
How does predictive analytics account for seasonality to improve forecast accuracy?
Predictive analytics plays a key role in improving forecast accuracy by identifying and accounting for seasonal patterns in data. For example, it can spot recurring trends like higher sales during Ramadan or holiday seasons, adjusting projections to reflect these regular fluctuations. This approach prevents temporary spikes or drops from distorting the overall forecast.
By applying techniques such as decomposition and autocorrelation analysis, predictive models can separate seasonal effects from long-term trends. This gives businesses in the UAE a clearer picture of their core performance. Whether it's planning inventory, setting budgets, or establishing revenue goals, this clarity helps organisations make smarter decisions. With reduced forecast errors, companies can align their strategies more effectively with the ever-changing market landscape.
How does predictive analytics account for seasonality in forecasts?
Predictive analytics tackles seasonality by spotting recurring patterns in data and adjusting for them. A popular method is seasonal decomposition, which splits data into three components: trend, seasonal, and residual. This separation makes it easier to isolate seasonal effects, ultimately improving forecast precision.
Advanced models like Seasonal ARIMA are specifically designed to account for seasonal patterns, making them a great choice for datasets with regular cycles. Additionally, automated tools, such as decomposition techniques or ARIMA-based algorithms, help refine forecasts by removing seasonal variations. These strategies provide businesses and economic planners with more dependable predictions, even in industries heavily influenced by seasonal shifts.
Why do predictive analytics models consider external factors when forecasting seasonality?
Predictive analytics models take into account external factors to make seasonal forecasts more precise and relevant. Variables like weather conditions, public holidays, cultural celebrations, and social trends play a crucial role in shaping consumer demand and revenue patterns. By considering these influences, these models can better adapt to seasonal changes and provide more accurate insights.
Take the UAE as an example. Events such as Ramadan, Eid holidays, or shifts in weather patterns lead to noticeable changes in consumer behaviour. When businesses incorporate these factors into their forecasts, they can make smarter decisions - whether it's adjusting inventory levels or crafting marketing campaigns that align with local demand trends.