
Blog / Top Metrics to Track in Omnichannel Campaign Automation
Top Metrics to Track in Omnichannel Campaign Automation
Want to boost your omnichannel campaigns? Start by tracking the right metrics.
Omnichannel automation connects customer interactions across platforms like email, WhatsApp, SMS, and more. But to drive results, you need to measure what matters. Here's a quick overview of the six key metric categories:
- Conversion Rate Per Journey: Tracks how effectively workflows (like cart recovery) turn interactions into purchases.
- Channel Engagement Metrics: Measures user actions (e.g., open, click, and reply rates) across email, SMS, and WhatsApp.
- Revenue and Value Metrics: Links workflows to AED outcomes, focusing on revenue per journey, AOV, and CLV.
- Journey and Funnel Health Metrics: Pinpoints where customers drop off or stall in your workflows.
- Attribution and ROI: Credits each channel's role in conversions and calculates ROI.
- Operational and Data Quality Metrics: Ensures smooth automation and accurate customer data.
These metrics help UAE businesses optimise campaigns, align with local preferences, and increase returns. For example, WhatsApp campaigns often outperform email with higher open rates and ROAS. By monitoring these categories, you can identify gaps, refine strategies, and achieve better customer engagement and revenue growth.
6 Key Metric Categories for Omnichannel Campaign Automation Success
Omnichannel Analytics and Channel Scoring for MORE SALES AND LOWER CHURN
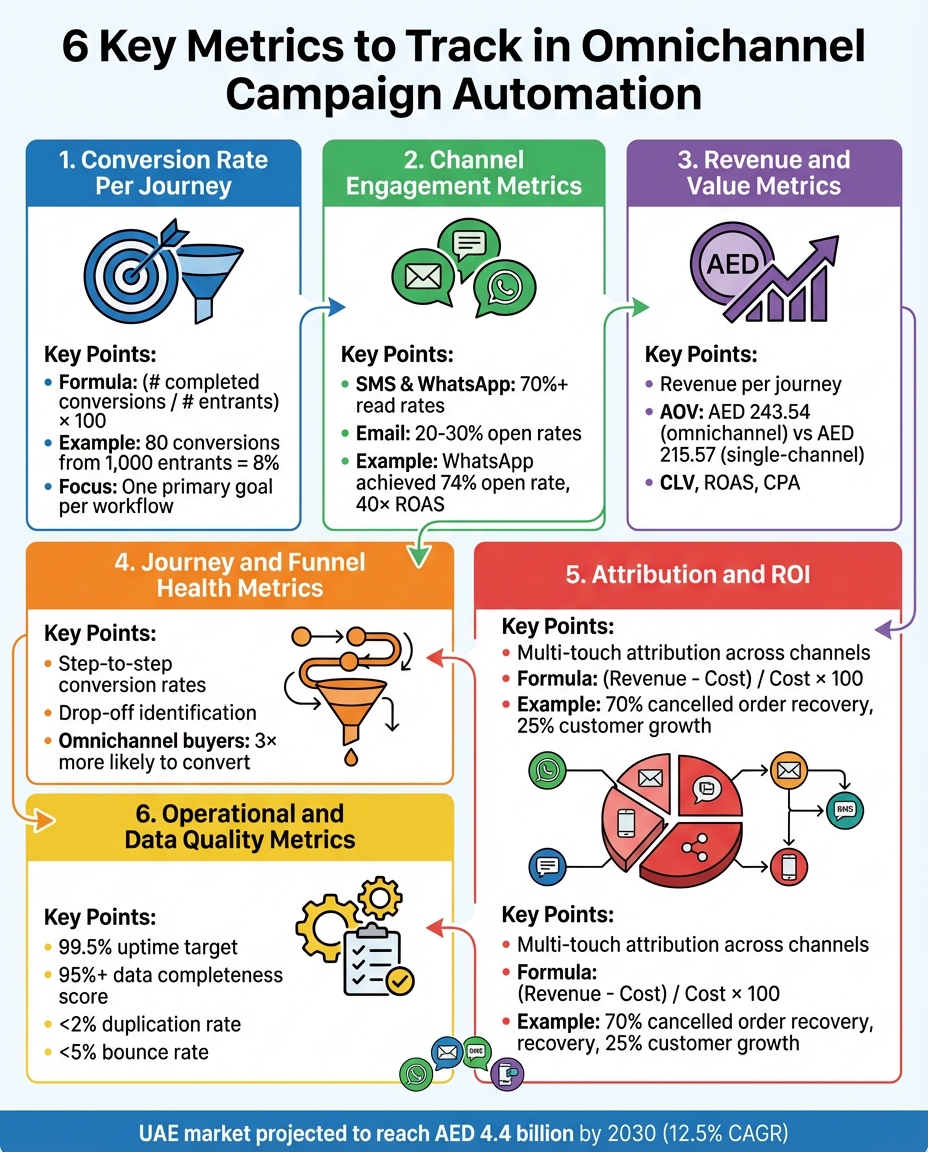
1. Conversion Rate Per Journey
The conversion rate per journey tracks the percentage of customers who achieve a specific goal upon entering an automated workflow. It’s calculated using this formula: (# completed conversions / # entrants) x 100. For instance, if 1,000 customers enter your abandoned cart recovery workflow and 80 make a purchase, the conversion rate is 8%.
It’s crucial to clearly define what counts as a conversion for each journey. In the UAE’s e-commerce sector, this often means a completed order. For banking and fintech, it might involve completing KYC verification or activating a card within 30 days. In the hospitality industry, conversions could range from confirmed bookings and table reservations to package upgrades. A welcome series might aim to drive a first purchase within seven days, while a win-back journey could focus on re-engaging inactive customers. Each workflow should have one primary goal tailored to your industry and aligned with customer intent.
To refine your approach, segment conversion rates based on entry channel, delivery methods, customer demographics, and device usage. For example, a welcome journey triggered by an in-store QR code and followed up via WhatsApp might achieve a 22% conversion rate, compared to 11% for an email-only approach. Given the widespread use of WhatsApp in the UAE, it’s worth testing different channel sequences, adjusting trigger timings, experimenting with offer types (e.g., percentage discounts vs AED-denominated offers), and varying message cadence. Controlled A/B tests can help pinpoint the most effective strategy.
Accurate measurement depends on maintaining a unified customer ID across all systems - CRM, email, SMS, WhatsApp, point-of-sale, and app platforms. This ensures you can recognise the same customer across multiple touchpoints. Track key events like page views, add-to-cart actions, form submissions, transactions, app interactions, and in-store purchases. Use source parameters such as UTMs, campaign IDs, or QR codes to determine which workflow enrolled each customer. For situations where browser tracking is less reliable - like on iOS devices or during private browsing - or for offline events like in-store redemptions, server-side or API tracking is essential. Ensure your platform is configured to use Gulf Standard Time and display monetary values in AED, adhering to local decimal and thousand-separator formats for precise UAE reporting.
Conversion rates at the journey level directly impact revenue. For example, if 80 out of 1,000 abandoned cart entrants convert, and each spends AED 150, the workflow generates AED 12,000. To assess customer lifetime value, multiply the conversion rate by the average order value and purchase frequency. This approach helps you identify which workflows deliver the highest AED return per contact, allowing you to prioritise efforts on those driving the most revenue. This is far more impactful than focusing solely on individual channel metrics. Next, we’ll examine how engagement across different channels further shapes campaign success.
2. Channel Engagement Metrics
Channel engagement metrics help track how users interact with email, SMS, and WhatsApp communications. For email, key indicators include open rate, click-through rate (CTR), click-to-open rate (CTOR), reply rate, unsubscribe rate, spam complaints, and bounce rates. SMS metrics focus on delivery rate, link CTR, reply rate, opt-out rate, and response time. For WhatsApp, it's essential to monitor delivery and read rates (blue ticks), reply rate, conversation start rate, average response time, template approval rate, and opt-out or block rates.
In the UAE, where mobile usage dominates, these channels deliver varying results. SMS and WhatsApp boast read rates exceeding 70%, far surpassing email open rates of 20–30%. However, email stands out for offering richer content and more detailed offers. For instance, a UAE-based fashion and lifestyle brand achieved a 74% open rate and a 40× return on ad spend (ROAS) by targeting promotions through WhatsApp Broadcast based on past purchases and engagement patterns. Similarly, a tech retailer streamlined conversations from Instagram, Facebook, and WhatsApp into a single platform, recovering 70% of cancelled orders and expanding its customer base by 25% through automated cart-abandonment reminders and enhanced order tracking.
Engagement metrics can also act as triggers within automated workflows. For example, if a cart-abandonment email remains unopened after 24 hours, an SMS reminder can follow. If the SMS isn't clicked, the system can escalate to a WhatsApp message with a detailed product preview. High reply rates on WhatsApp might prompt assignment to a human agent, while high unsubscribe or block rates can automatically reduce communication frequency or remove the channel from a customer's preferences. Similarly, low open or click rates could trigger A/B testing for new subject lines or direct high-intent clickers into sales-assisted threads. These triggers ensure consistency across the customer journey and highlight the importance of a unified data platform.
To achieve this, use an omnichannel platform that integrates email, SMS, WhatsApp, and web/app data under a single customer ID. This typically involves connecting your email service provider, SMS gateway, and WhatsApp Business API with a customer data platform or marketing cloud. Consistent UTM parameters, tracking links, and dashboards are crucial for monitoring engagement by journey step, channel, and audience segment - for example, differentiating Emirati customers from expatriates in Dubai. In the UAE, ensure compliance with local data privacy laws and hosting regulations, particularly in highly regulated industries.
Beyond basic engagement, focus on metrics that drive conversions. For SMS and WhatsApp, link-based CTRs followed by add-to-cart or checkout starts are strong indicators of potential revenue. For email, CTOR and post-click conversion rates provide more meaningful insights than open rates. Prioritise metrics like post-click conversion and revenue per message, followed by CTR and response rates, with opens and deliverability as secondary measures. Leverage engagement data to fine-tune timing, relevance, and channel preferences rather than increasing message volume. Build preference centres and use engagement history to identify optimal channels and send times, keeping the UAE's Friday–Sunday weekend in mind. Limit communications for customers with low engagement or high opt-out tendencies to maintain trust and respect.
3. Revenue and Value Metrics
Revenue and value metrics connect your automation efforts directly to revenue outcomes. Key indicators like revenue per journey, average order value (AOV), customer lifetime value (CLV), return on ad spend (ROAS), and cost per acquisition (CPA) help determine whether your automated strategies are delivering profitable results. For marketers in the UAE, tracking these metrics in AED and linking them to specific workflows - such as cart recovery, welcome series, or win-back campaigns - provides clarity on which strategies yield the best returns. This insight helps prioritise high-impact workflows and supports investments in platforms, data integration, and creative assets.
AOV (Average Order Value) reflects the average size of each transaction, offering insights into how well cross-sell and upsell strategies are working. According to OmniSend, omnichannel marketing generates an AOV of US$66.31 per order compared to US$58.70 for single-channel strategies, proving the financial advantage of coordinated messaging across platforms like email, WhatsApp, SMS, and mobile apps. In the UAE, where mobile messaging is highly prevalent, combining WhatsApp recommendations with email bundles and app push notifications can significantly boost basket sizes. To calculate AOV, divide total revenue by the number of completed orders. Experiment with different incentives - such as free shipping or percentage discounts - to identify which offers drive higher transaction values.
CLV (Customer Lifetime Value) measures the total revenue a customer brings over their entire relationship with your brand. This metric is crucial for audience segmentation and designing loyalty programmes. You can create value-based segments - like top 10% VIPs, mid-value customers, and low-value customers - and guide them into tailored automated campaigns with appropriate offers and service levels. For instance, high-CLV customers might receive early access to exclusive promotions via WhatsApp and email, while lower-value customers could enter re-engagement flows aimed at increasing purchase frequency. To ensure accurate CLV calculations, unify transactional data from online, offline, and messaging channels into a centralised customer data platform. In the UAE, where data privacy regulations are strict, make sure your practices comply with local rules when consolidating customer information. CLV not only provides a snapshot of past performance but also helps project future revenue potential.
ROAS (Return on Ad Spend) and overall ROI are essential for evaluating the profitability of your omnichannel automation efforts. ROAS is calculated by dividing the revenue generated by a campaign by the ad spend. For example, AED 40,000.00 in revenue from AED 1,000.00 in ad spend results in a 40× ROAS. A great local example is TKD Lingerie, a UAE-based fashion and lifestyle brand, which achieved this exact ROAS figure through a WhatsApp-driven promotion. They used automation to target customers based on previous purchases and engagement patterns. Overall ROI takes it a step further by factoring in platform fees and operational costs, calculated as (total incremental revenue minus total costs) divided by total costs. Comparing automated workflows to baseline groups allows you to reallocate budgets to the most effective strategies.
To make these metrics actionable, break them down by journey, channel mix, and customer segment. For example, compare revenue per journey across workflows to identify top performers, segment AOV and CLV by channel combinations (e.g., email plus WhatsApp versus email alone) to evaluate the added value of each touchpoint, and establish minimum thresholds to deactivate or redesign underperforming workflows. Integrating your marketing automation platform with ecommerce systems, payment gateways, and point-of-sale data ensures accurate attribution across online and offline interactions. For additional support, consider working with a data-driven consultancy like Wick to build unified analytics that maximise the return on every AED spent. By focusing on these financial measures, you can continuously refine your omnichannel workflows to identify the best-performing combinations of channels, timing, and offers.
4. Journey and Funnel Health Metrics
Journey and funnel health metrics track how customers navigate your automated workflows - from initial awareness to making a purchase and beyond. Unlike focusing solely on final conversion numbers, these metrics highlight where customers stall, drop off, or move quickly through each stage of your omnichannel campaigns. For marketers in the UAE managing workflows across email, WhatsApp, SMS, mobile apps, and in-store touchpoints, monitoring progression at every step helps uncover friction points and address them before they impact revenue.
These metrics build on conversion and engagement data to provide insights into customer behaviour. Key metrics include step-to-step conversion rates (e.g., from email click to product view or from WhatsApp message to payment completion), drop-off rates at each step, time taken to move between stages, and overall journey completion rates. For instance, a UAE digital bank identified where users were dropping off during onboarding. By refining their messaging across channels, they achieved a 16% increase in debit card activations. This example shows how tracking each step lets you intervene exactly where customers face challenges.
To identify friction, define and map each stage of your automated journey. For example, if 60% of users drop off between "clicked payment link" and "completed purchase" in a mobile campaign, it could indicate issues with checkout or payment options - perhaps common UAE payment methods aren’t offered, or the mobile experience is cumbersome. Combining conversion data with metrics like bounce rates, time on site, and click-through rates can help pinpoint problems. If your landing page has a high bounce rate, focus on improving page speed, mobile usability, and content relevance - especially important in the UAE's mobile-first market. These insights enable you to fine-tune channel sequences and implement recovery strategies.
Segmenting journey analytics by channel mix (e.g., push notifications, WhatsApp, or retargeting ads) can help identify which combinations work best. Data shows that omnichannel buyers are more valuable: the average order value in omnichannel campaigns is US$66.31 compared to US$58.70 for single-channel campaigns. Additionally, customers engaging with multiple touchpoints in the same journey are up to three times more likely to convert than those exposed to just one. This underscores how smoother, multi-step journeys can boost both conversion rates and basket sizes.
To make these metrics actionable, set clear benchmarks for each stage - for example, aiming for at least a 20% uplift at every step - and use automation to respond to metric changes. If a user lingers in one stage for seven days, trigger a recovery journey using a different channel or offer. Tailor your strategies to local contexts, aligning campaigns with UAE-specific holidays and pay cycles like Ramadan, Eid, and end-of-month salary days. These metrics offer a comprehensive view of how each touchpoint impacts your omnichannel performance. For expert support, consider working with a data-driven consultancy like Wick to integrate tracking and turn funnel insights into sustained growth.
sbb-itb-058f46d
5. Attribution and Return on Investment
Having unified customer data is essential for effective multi-touch attribution. This method credits every interaction a customer has with your brand throughout their journey. In the UAE, where customers engage via platforms like WhatsApp, Instagram, email, SMS, and in-store visits, understanding these touchpoints is crucial. While last-touch attribution is straightforward, it overlooks earlier influences. Multi-touch attribution, on the other hand, provides a broader perspective by considering every interaction - from a LinkedIn ad to a follow-up email. This approach helps fine-tune workflows by identifying what truly drives results. Once touchpoints are identified, you can calculate campaign ROI to measure success.
To calculate ROI for omnichannel campaigns, track revenue against costs across all channels. The formula is simple: (Revenue – Cost) / Cost × 100. Be sure to factor in expenses like tool subscriptions (approximately AED 1,287/month for professional plans) and creative development costs. Analysing revenue contributions from each channel provides clarity. For instance, Anigma Technologies used centralised attribution across Instagram, Facebook, and WhatsApp to recover 70% of cancelled orders and increase their customer base by 25%.
AI-powered models can further refine attribution by assigning credit based on actual impact. Tools like DashThis integrate data from Google Analytics, Facebook Ads, and HubSpot, enabling real-time insights and anomaly detection. Similarly, SleekFlow offers analytics tailored for WhatsApp, Facebook, and CRM, which is particularly valuable in the UAE, where WhatsApp is a dominant communication channel. These platforms simplify ROI measurement by consolidating data into unified dashboards. Such insights reveal that combining channels - like email, social media, and web - can drive conversion rates up to three times higher than single-channel efforts. These findings also connect to key metrics like Customer Lifetime Value (CLV) and Cost Per Acquisition (CPA), helping guide budget decisions.
Keep an eye on metrics like CLV, CPA, and revenue uplift per channel to make informed budget reallocations. Attribution also enhances the customer journey by providing a cohesive understanding of interactions. For example, knowing a customer clicked an Instagram ad, browsed your website, and later received a WhatsApp message allows you to personalise follow-ups. This tailored approach can reduce churn and foster loyalty. In the UAE, aligning tracking efforts with local shopping trends - such as Ramadan, Eid, and salary days - can significantly amplify campaign effectiveness.
To address challenges like data silos and integration issues, consolidate CRM data with automation tools. Using AI for segmentation and automating reporting ensures both compliance and accuracy. Real-time data-driven attribution models allow you to adjust campaigns dynamically, focusing on the most impactful touchpoints. For specialised support, consider partnering with a consultancy like Wick, which excels in unifying customer data and optimising omnichannel strategies. By refining attribution and ROI measurement, you can enhance automated workflows and achieve sustainable growth.
6. Operational and Data Quality Metrics
After analysing conversion, engagement, revenue, and funnel metrics, operational and data quality metrics complete the picture for a well-rounded campaign measurement framework. Operational metrics like automation uptime, execution rate, and task latency ensure campaigns run smoothly by reducing downtime and keeping message triggers prompt. For example, maintaining a 99.5% uptime is crucial to avoid revenue losses caused by system failures. This is especially important for UAE-based e-commerce brands that depend on automated cart abandonment reminders sent via email, WhatsApp, and SMS. Equally important is the quality of your data, which plays a key role in campaign success.
Data quality metrics go beyond performance and focus on accuracy and reliability. Key indicators include the data accuracy rate (the percentage of correct customer records, like verified emails or phone numbers), duplication rate (the percentage of duplicate profiles), and data completeness score (the proportion of completed fields in a customer profile, ideally above 95%). Poor data quality can lead to personalisation errors and high bounce rates. For instance, TKD Lingerie in the UAE leveraged SleekFlow's centralised CRM data for WhatsApp broadcasts, achieving a 40× return on ad spend and an impressive 74% open rate by ensuring accurate customer records. Clean data is a catalyst for better engagement and higher revenue.
Real-time dashboards simplify tracking these metrics. Platforms like CleverTap and SleekFlow provide tools for monitoring execution errors, data freshness, and integration health through APIs. Automated audits can flag issues like bounce rates exceeding 5% or duplication rates above 2%, allowing for quick resolutions without requiring custom coding. This kind of monitoring is especially critical for small and medium enterprises (SMEs) in the UAE, as the marketing automation market is projected to grow to AED 4.4 billion by 2030, with a compound annual growth rate of 12.5%.
Operational efficiency directly enhances customer experience. For instance, one UAE e-commerce brand using CleverTap's autonomous journeys achieved a 400% boost in conversions by minimising downtime and ensuring consistent messaging. Similarly, Anigma Technologies saw 25% customer growth and recovered 70% of cancelled orders by using SleekFlow’s automation tools to improve data accuracy. These examples highlight how operational excellence and clean data translate to increased revenue and greater customer satisfaction.
Strong operational performance and high-quality data are the backbone of any successful omnichannel strategy. To effectively implement these metrics, consider using unified platforms that centralise CRM and analytics, set up alerts for critical thresholds like duplication rates exceeding 2%, and deploy AI tools for real-time audits. Tailor your tracking to the UAE market by monitoring AED currency conversions and aligning campaigns with shopping trends during Ramadan, Eid, and salary payment cycles. For expert assistance in unifying data and optimising workflows, explore partnerships with firms like Wick, known for building seamless digital ecosystems with intelligent data systems and advanced analytics tracking.
Comparison Table
Looking at metrics side by side helps identify which journeys, channels, and customer segments are delivering the best outcomes. For example, comparing conversion rates across onboarding, purchase, and retention stages can highlight areas that need attention. Mashreq Neo, for instance, saw a 16% increase in debit card activations through cohort analysis during their onboarding process. These comparisons serve as a foundation for further channel and segmentation evaluations.
When it comes to channels, comparisons can be especially insightful for UAE businesses. WhatsApp stands out as a top performer in the UAE. TKD Lingerie achieved an impressive 74% open rate and a 40× return on ad spend using WhatsApp broadcasts. On the other hand, MAC Cosmetics recorded a 14% click-through rate through web push notifications. A table comparing key metrics like open rates, click-through rates, and revenue (in AED) across email, SMS, WhatsApp, and social media can make budget allocation decisions much clearer. For instance, if WhatsApp generates AED 1,200,000 in revenue compared to AED 500,000 from email, the priority becomes obvious.
Segmentation also plays a critical role in refining strategies for different customer groups. Research indicates that multi-channel customers are 3× more likely to convert compared to those using a single touchpoint. By comparing high-value versus low-value segments, businesses can craft more targeted approaches. Anigma Technologies used WhatsApp automation across social channels to focus on at-risk segments, recovering 70% of cancelled orders and achieving 25% customer growth. Metrics like customer lifetime value (CLV), average order value (AOV), and engagement rates can help pinpoint the most profitable segments.
Adding multi-touch attribution to your comparison tables provides even deeper insights. Instead of giving all credit to the last touchpoint, this method tracks how various channels contribute throughout the customer journey. For instance, LinkedIn ads might generate initial awareness, while retargeting emails close the sale. A table showing first-touch versus last-touch attribution percentages by channel can reveal opportunities to improve weaker touchpoints. This aligns with the growing focus on analysing the entire customer journey. For example, omnichannel marketing results in an average order value of AED 243.54 (USD 66.31), compared to AED 215.57 (USD 58.70) for single-channel strategies. These multi-touch insights complement operational metrics discussed in the next section.
When building tables, use UAE-specific formats, including AED currency (e.g., AED 1,234.56), DD/MM/YYYY dates, and metric units. Operational metrics, such as data completeness scores, should also be included alongside performance metrics to ensure a holistic view of journey health. Companies like Wick specialise in creating advanced tracking frameworks tailored to the UAE market, taking into account unique patterns like Ramadan and Eid shopping behaviours.
Conclusion
The six metric categories - conversion, engagement, revenue, funnel health, attribution, and operational data - work together to transform omnichannel automation into a powerful revenue generator. Each plays a distinct role: conversion rate per journey pinpoints which automated paths effectively create customers, while channel engagement metrics highlight where attention is gained or lost across platforms like WhatsApp, email, SMS, and push notifications. Revenue and value metrics connect customer activity to AED outcomes, such as average order value and lifetime value. Meanwhile, journey and funnel health metrics uncover where UAE customers might disengage. Attribution and ROI metrics tie spending to returns across every channel and workflow. Lastly, operational and data quality metrics ensure that triggers, segments, and integrations are accurate, maintaining trust in all other reporting sources. Together, these metrics create a roadmap for actionable improvements.
For businesses in the UAE, this method of tracking delivers tangible results. Local data shows that omnichannel strategies lead to higher AED returns. Regular monitoring of these categories helps refine targeting, align with local preferences, and enhance customer experiences. This approach not only drives repeat purchases but also boosts customer lifetime value in AED terms.
To make the most of these metrics, focus on defining 1–2 key KPIs for each category. Set up segmented dashboards and conduct monthly reviews to identify underperforming journeys. Ensure data governance practices are in place to maintain accurate consent and profile fields. For expert guidance in setting up unified data and automation frameworks, consider specialised consultancy services like Wick, which offers expertise in automation, analytics, and unified data through its Four Pillar Framework.
As the UAE market continues to expand, with projections reaching approximately AED 4.4 billion by 2030, CFOs are placing greater emphasis on clear revenue attribution from automation investments. By tracking these six metric categories, businesses can shift from fragmented, channel-specific reporting to a customer-journey-focused optimisation approach. This not only increases revenue but also enhances customer satisfaction. The outcome? A digital ecosystem that grows sustainably while delivering the personalised, seamless experiences that UAE customers now expect.
FAQs
What key metrics should you monitor for successful omnichannel campaign automation?
To make your omnichannel campaign automation work effectively, keep a close eye on customer engagement rates, conversion rates, customer lifetime value (CLV), and return on ad spend (ROAS). These key metrics reveal how well your campaigns connect with your audience and the impact they’re having on your bottom line.
You should also track click-through rates (CTR) and bounce rates to gauge the performance of specific channels. On top of that, assess how well your data integration is functioning to ensure smooth personalisation and a cohesive customer experience. By diving into these metrics, you can fine-tune your approach and drive tangible results.
What are the best ways for businesses in the UAE to enhance their omnichannel marketing strategies?
To strengthen omnichannel marketing efforts in the UAE, businesses should prioritise bringing together data and evaluating performance across all digital platforms using automation tools. A unified strategy helps create smooth digital experiences that boost audience interaction and make campaigns more efficient.
Using AI-powered insights to personalise content and messaging is crucial for fostering strong customer connections. At the same time, tracking key performance metrics like engagement rates, conversion rates, and campaign success across various platforms ensures ongoing optimisation. Aligning strategies with local cultural norms and digital behaviours is essential for achieving the best results.
Why is having a unified customer ID important for omnichannel campaigns?
A unified customer ID plays a crucial role in delivering smooth and personalised experiences across all channels in your omnichannel campaigns. It brings together customer interactions into a single, clear view of their journey. This not only simplifies data analysis but also enhances targeting and streamlines workflows.
With a unified customer ID in place, businesses can ensure consistent messaging, boost engagement, and strengthen customer loyalty. At the same time, it helps refine automation and improve decision-making processes for more efficient operations.