
Blog / Top 7 Metrics for AI Personalization Success
Top 7 Metrics for AI Personalization Success
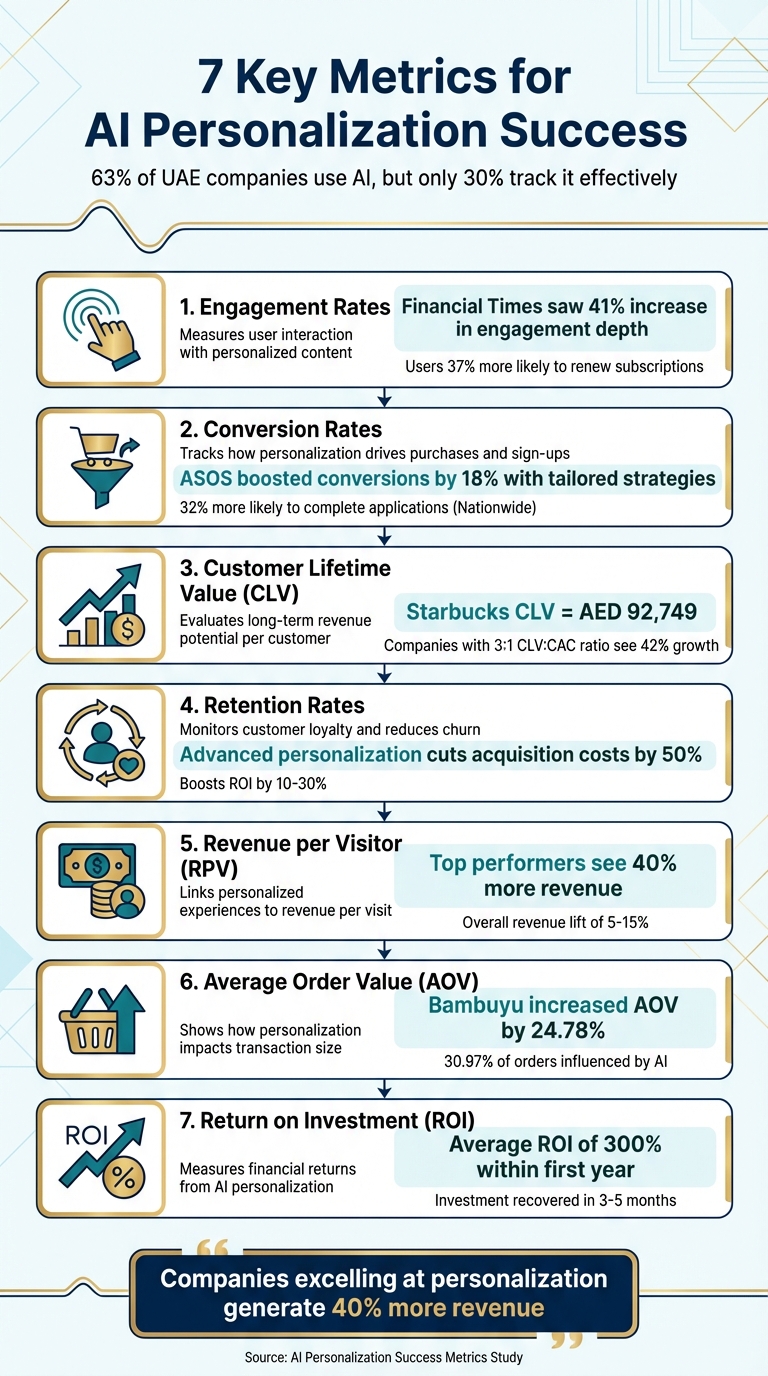
AI personalization is transforming the UAE's business landscape, with 63% of companies already leveraging AI or automation. Yet, only 30% have effective metrics to track success. The article breaks down seven key metrics that businesses should focus on to measure AI-driven personalization effectively:
- Engagement Rates: Measures user interaction with personalized content (e.g., clicks, likes, shares). Examples include a 41% increase in engagement depth for Financial Times subscribers.
- Conversion Rates: Tracks how personalization drives actions like purchases or sign-ups. For instance, ASOS boosted conversions by 18% with tailored price-focused strategies.
- Customer Lifetime Value (CLV): Evaluates long-term revenue potential per customer. Starbucks, for example, estimates a CLV of AED 92,749.
- Retention Rates: Monitors customer loyalty and churn. AI personalization can reduce churn and increase repeat purchases.
- Revenue per Visitor (RPV): Links personalized experiences to revenue per website visit. Companies with advanced personalization see up to 40% more revenue.
- Average Order Value (AOV): Shows how personalization impacts transaction size. Bambuyu increased AOV by 24.78% using AI-driven recommendations.
- Return on Personalization Investment (ROI): Measures financial returns from AI personalization efforts. Businesses report an average ROI of 300% within the first year.
Understanding and tracking these metrics helps UAE businesses turn AI personalization into a measurable, profitable investment. The article also highlights tools like Wick’s framework, designed to help companies in the UAE optimize these metrics effectively.
7 Key Metrics for AI Personalization Success in UAE Businesses
Scaling AI for Maximum Business Impact – Key Metrics & Strategies
1. Engagement Rates
Engagement rates tell you how well your audience interacts with personalised content - whether through clicks, likes, shares, or even how far they scroll. Think of this as your immediate feedback loop: if engagement is low, something isn’t clicking with your audience’s expectations.
Take some real-world examples to see this in action. Back in 2019, the Royal Bank of Scotland used AI-powered personalisation in their digital banking services. The result? Customers who received tailored financial guidance reported 15% higher satisfaction scores and were 8% more likely to apply for financial products compared to those who got generic advice. Fast forward to 2021, and Ocado, the British online supermarket, saw similar successes. Their personalised recommendations led to an 18% increase in click-through rates and a 23% boost in customers adding complementary items to their baskets.
"Interaction rates on personalised elements instantly reveal if your 'relevance' is relevant."
- Anubhav Verma, Associate Content Marketing Manager, Optimizely
To measure these results effectively, set benchmarks before rolling out personalisation. Control groups are a great way to compare the impact of personalised experiences versus generic ones. For instance, in 2021, the Financial Times introduced an "engagement depth" metric that factored in time spent, scrolling, and sharing activity. Their personalised recommendations improved engagement depth by 41%, and subscribers with higher depth scores were 37% more likely to renew their subscriptions. These kinds of insights lay the groundwork for better conversion and retention rates.
But don’t stop at clicks. Look deeper - are users actually interacting with your recommendations, or just aimlessly clicking? For example, if users spend a lot of time on your site, it could mean they’re confused rather than engaged. Pay attention to specific actions like "add to wishlist" or "add to cart." These can reveal whether customers find your platform easy to navigate or if they’re hitting roadblocks.
All of this sets the stage for the next step: how these interactions translate into higher conversion rates.
2. Conversion Rates
Engagement rates might show initial interest, but conversion rates reveal if that interest translates into revenue. They directly connect personalised digital experiences to actual income streams. This metric doesn’t just measure interest - it determines if your strategies lead visitors to take meaningful actions, like making a purchase, signing up for a service, or requesting a demo.
Conversion rates offer more than just insight into effectiveness; they also highlight weak spots in your sales process. For instance, in 2022, Nationwide Building Society introduced personalised mortgage calculators and guides. Their analysis revealed that prospects who interacted with personalised content were 32% more likely to complete applications and experienced a 14% reduction in decision-making time. This made the customer journey faster and more seamless.
"If your personalisation isn't converting more visitors, you're just creating digital wallpaper."
- Anubhav Verma, Associate Content Marketing Manager, Optimizely
One critical metric to track is incremental lift - the additional conversions driven solely by personalisation. To measure this accurately, using control groups is essential. For example, in 2020, ASOS discovered that price-focused personalisation boosted conversion rates by 18% among occasional shoppers, while style-based personalisation extended browsing time by 27% for frequent buyers. This demonstrates the importance of segmenting audiences and tailoring strategies accordingly.
Don’t just focus on primary conversions - micro-conversions like newsletter sign-ups, wishlist additions, or demo requests can expose friction points in the customer journey. Before rolling out any personalisation strategy, establish benchmarks using 3–6 months of historical data. Then, track how users move from their first personalised interaction to the final action.
3. Customer Lifetime Value (CLV)
While conversion rates focus on immediate sales, Customer Lifetime Value (CLV) looks ahead, estimating the total revenue a customer will generate over their relationship with a business. It’s a key metric that highlights future buying potential.
Interestingly, 75% of senior executives consider CLV a critical measure. Companies with a CLV-to-Customer Acquisition Cost (CAC) ratio exceeding 3:1 see annual growth rates of 42%, compared to just 28% for those with lower ratios. This underscores how AI-driven personalisation can foster long-term customer loyalty, rather than relying solely on one-off purchases.
Take Starbucks as an example. They estimate an average CLV of AED 92,749 (≈US$25,272), based on an average purchase of AED 21.66 (US$5.90), with customers visiting 4.2 times per week over a 20-year period. Similarly, Bear Mattress revamped its cross-sell process and tailored recommendations using purchase history data, which resulted in a 16% revenue increase.
"When you can draw a direct line from your personalisation efforts to an increase in CLV, you have an undeniable case for its strategic importance."
To maximise CLV, businesses should focus on encouraging repeat purchases, expanding product categories, and shortening the time between transactions. Advanced analytics can be used to analyse complete customer histories, enabling accurate CLV predictions. Additionally, comparing personalised customer segments to non-personalised control groups helps pinpoint the added value generated by AI. Since poor onboarding accounts for 23% of customer churn, incorporating personalised tips and guides during the post-purchase phase can significantly enhance long-term loyalty.
4. Retention Rates
Retention rates measure how many customers stick around and remain engaged with your service over time. Unlike conversion rates, which capture a single moment in the customer journey, retention provides a deeper look into whether your AI-driven personalisation is fostering meaningful, long-term relationships or just sparking one-time interactions. By focusing on both retention and churn, you can better evaluate the real impact of personalised strategies.
Retention rates are closely tied to churn rates - the percentage of customers who stop using your service or cancel their subscriptions within a specific timeframe. If churn rates are climbing, it’s a clear signal that your personalised experiences might not be hitting the mark. On the flip side, a drop in churn suggests your AI efforts are resonating with customers, making them feel "seen and understood".
The financial benefits of strong retention are hard to ignore. Companies that excel at personalisation generate 40% more revenue from their personalised efforts compared to average performers. Moreover, advanced personalisation can slash acquisition costs by up to 50% and boost ROI by 10–30%. These impressive results stem from AI’s ability to analyse data and identify patterns, such as repeat purchases.
To effectively track retention, it’s essential to establish a baseline. Collect 3–6 months of data before rolling out major AI-driven changes to account for seasonal trends. Always compare personalised experiences with a non-personalised control group to ensure your results are directly tied to your AI initiatives. Pay special attention to key lifecycle moments, such as the period right after a customer’s first purchase, to see where AI interventions are most effective in preventing drop-offs.
"Great personalisation doesn't just drive one-time conversions; it builds relationships that foster loyalty, increase purchase frequency, and reduce churn."
- Stravix
In addition to retention metrics, use qualitative tools like Net Promoter Scores to gain deeper insights into how customers perceive your personalisation efforts. Together, these metrics and insights demonstrate how AI personalisation not only sparks initial interest but also cultivates lasting customer loyalty.
sbb-itb-058f46d
5. Revenue per Visitor (RPV)
Revenue per Visitor (RPV) measures the average revenue earned each time someone visits your website. It’s calculated by dividing your total revenue by the number of visits. This metric goes beyond just tracking conversions - it gives you insight into the financial impact of AI-driven personalisation efforts.
While conversion rates tell you how many visitors make a purchase, RPV provides a fuller picture by combining the number of buyers with how much they spend. It highlights how personalised experiences translate into actual revenue. In the case of AI-driven personalisation, RPV helps determine whether tailored customer interactions are boosting your bottom line or falling short. When AI tools cater to individual preferences, they can lead to higher engagement and increased spending. In fact, companies that excel in personalisation often see up to 40% more revenue from these efforts, with advanced strategies contributing an overall revenue lift of 5–15%.
To effectively track RPV, start by establishing a baseline using 3–6 months of historical data to account for seasonal trends. Then, compare the RPV of visitors experiencing AI-driven personalisation against a control group that doesn’t receive personalised content. Tools like Google Analytics, Mixpanel, or Amplitude can automate this process, reducing errors and enabling real-time tracking. Additionally, segment your data by factors like demographics, behaviour, or device type to pinpoint which personalised experiences are the most profitable. If your primary focus is increasing revenue, prioritise RPV over engagement metrics like time spent on site, as it directly measures financial performance.
However, it’s important to keep an eye on other metrics too. For instance, high bounce rates on personalised pages could indicate that the AI isn’t delivering content that’s immediately relevant, potentially undermining your revenue goals. By tracking RPV alongside other indicators, you gain a clearer understanding of how well your personalisation strategies are converting visitor interest into actual revenue.
6. Average Order Value (AOV)
Average Order Value (AOV) is a simple yet powerful metric: divide your total revenue by the number of orders, and you’ve got a clear picture of how much each transaction is worth on average. It’s also one of the best ways to gauge how well AI personalisation is influencing revenue per transaction. Whether it’s through product recommendations, cross-selling, or upselling, AOV helps you see if your AI strategies are hitting the mark.
AI personalisation works by analysing subtle behaviours - like how long someone spends on a page, what they’ve purchased before, or how far they scroll. Using this data, AI acts like a personal shopper, suggesting items that align with a shopper’s intent. Instead of random suggestions, it recommends complementary products or items that complete a routine. This approach resonates especially well in the UAE, where 90% of consumers are open to sharing their data for a more personalised and seamless shopping experience.
The results? Impressive. Take Bambuyu, a sustainable FMCG brand based in the UAE. By teaming up with Anphonic to integrate AI-driven product discovery into their search and cart features, they saw a 24.78% increase in AOV. Even better, 30.97% of their orders were influenced by AI personalisation. Another example is Nuutjob, co-founded by Ananya Maloo. They used Smart Cart features and "Buy More, Save More" strategies to educate customers about hygiene routines. The result? A month-on-month AOV increase of 21–44%, with AI-powered sales making up as much as 30% of total revenue.
"It feels like we now have a personal shopper for every customer"
- Ananya Maloo
To make the most of AOV tracking, precision is key. Use control groups to measure how personalised experiences compare to standard ones. Break down your data by demographics, behaviour, or loyalty tiers to find out which segments respond best to AI-driven recommendations. Basic tools like Google Analytics can help, but platforms like Mixpanel or Amplitude offer deeper insights into customer behaviour. You can also experiment with strategies like free shipping or limited-time discounts to encourage higher order values.
AOV isn’t just about numbers - it’s tied directly to the customer experience. When AI delivers spot-on recommendations, it saves shoppers time and effort, making the process feel natural rather than like a hard sell. On the flip side, if your AOV starts to drop despite steady traffic, it could be a sign of "model drift." This means your AI models might need retraining to keep up with changing customer preferences.
7. Return on Personalisation Investment (ROI)
Return on Personalisation Investment (ROI) is a key metric that shows whether your AI personalisation efforts are delivering real financial benefits. The formula is straightforward: ROI = ((Gain from AI – Cost of AI) ÷ Cost of AI) × 100. This calculation reflects the net financial gain compared to the cost of developing, deploying, and maintaining AI systems [26,27]. In essence, it shifts personalisation from being just a marketing expense to becoming a significant profit driver.
Here’s the exciting part: businesses implementing AI-powered personalisation report an average ROI of 300% within the first year, with top performers seeing returns exceeding 800%. Most companies recover their initial investment in just 3 to 5 months.
"The ROI was immediate and substantial. We recovered our investment in just 3 months."
- VP of Digital Commerce at a global e-commerce leader.
These impressive returns highlight the importance of precise measurement. To calculate ROI effectively, start by quantifying the incremental revenue lift - the additional revenue or conversions directly attributable to personalisation. This requires disciplined A/B/n testing, where a control group receives non-personalised content for comparison [13,14]. Include all relevant revenue improvements, such as higher conversion rates, increased average order value (AOV), and better customer lifetime value (CLV), alongside any marketing cost savings [14,30].
Don’t overlook the costs. Factor in all expenses, including platform licensing fees, which typically range from AED 183,000 to AED 733,000 annually, implementation costs (AED 110,000–550,000 one-time), and training expenses (AED 37,000–183,000 one-time) [25,30].
Another critical step is to establish baselines before launching your AI initiatives. Document your current metrics to create a clear starting point [26,28]. Use data-driven attribution models to credit multiple AI-driven touchpoints throughout the customer journey, rather than just the last interaction. Additionally, track your "time-to-value" - how quickly your project moves from proof-of-concept to delivering measurable outcomes. Shorter timelines often indicate better alignment with business objectives.
With these strategies in place, UAE businesses can leverage tools like Wick’s integrated approach to monitor and optimise these metrics, ensuring that personalisation efforts align with their goals and deliver tangible results.
How Wick Helps UAE Businesses Track These Metrics
Wick's Four Pillar Framework offers UAE businesses a structured way to monitor and refine AI personalisation metrics. This framework is built around four interconnected stages: Build & Fill (creating digital assets), Plan & Promote (executing digital campaigns), Capture & Store (leveraging data analytics and mapping customer journeys), and Tailor & Automate (applying marketing automation and personalisation strategies). By integrating these stages, businesses gain a comprehensive view of the consumer journey, avoiding isolated data analysis and enabling more cohesive strategies. This method forms the foundation for delivering measurable AI personalisation results.
In a market like the UAE, with its diverse and affluent customer base, and an AI retail sector expected to reach USD 1.307 billion (around AED 4.8 billion) by 2030, businesses require a partner that understands local nuances. Wick’s approach strikes a balance between automation and transparency, addressing the growing preference among UAE consumers for integrity and openness over mere personalisation.
Wick aligns its strategies with key AI personalisation metrics such as engagement, conversion rates, and customer lifetime value (CLV). The consultancy employs a multi-step measurement process that starts with establishing baseline metrics, followed by controlled A/B testing, real-time monitoring through dashboards, and continuous, evidence-based improvements. Additionally, Wick supports businesses in adopting Customer Data Platforms (CDPs) to unify data and enable real-time personalisation across multiple channels. These efforts respect privacy concerns by using zero-party data strategies, ensuring customer preferences are securely managed.
For businesses in the highly competitive retail, banking, and service sectors of the GCC - where digital adoption exceeds 95% - Wick offers tailored strategies with transparent AED pricing. Its plans range from Basic, which covers essential digital marketing services, to Enterprise, which delivers full-scale digital transformations, incorporating AI-driven personalisation and strategic consulting. This flexible, metric-driven approach ensures that UAE businesses of all sizes are equipped to thrive in a rapidly evolving digital landscape.
Conclusion
Tracking these seven metrics transforms AI personalisation into a powerful tool, helping businesses measure the incremental revenue that truly matters. This method doesn’t just increase revenue - it also significantly reduces acquisition costs.
"The right metric navigates you toward your goal and prevents you from getting lost on the wrong path." - Ketan Pande, Content Marketer, VWO
In the UAE’s competitive digital landscape, relying on data-driven measurement is no longer optional. Establishing clear baselines, conducting controlled A/B tests, and using algorithmic attribution models ensure that every dirham spent on personalisation yields measurable results. This approach transforms personalisation from being just another marketing expense into a key business investment, fostering long-term, profitable customer relationships. These insights not only validate your efforts but also open the door to more advanced AI strategies tailored to the UAE market.
The next step? Turning data into actionable strategies. The real challenge lies in converting metrics into insights that influence executive decisions. Currently, only 30% of companies have the right metrics to measure personalisation success effectively. This gap presents a major opportunity for businesses ready to step up. By prioritising metrics like CLV, RPV, and ROI, organisations can win executive support and justify ongoing investment in AI-driven initiatives.
Collaborating with skilled partners who understand both the technical challenges of AI personalisation and the unique dynamics of the UAE market can speed up this process. A well-structured framework that combines data analytics, customer journey mapping, and continuous optimisation allows businesses to shift from reactive to predictive strategies. This proactive approach helps them stay ahead of customer expectations while gaining a sustainable competitive edge. By mastering these metrics, businesses in the UAE can ensure that every dirham invested in AI personalisation delivers maximum impact.
FAQs
How does AI-driven personalisation boost customer lifetime value in the UAE?
AI-powered personalisation is reshaping how businesses in the UAE enhance customer lifetime value (CLV). By tailoring experiences to individual preferences, companies can meet unique customer needs, fostering trust and loyalty - two pillars of long-term relationships in this region. Through the analysis of customer behaviour and the use of machine learning, businesses can offer relevant deals, customised content, and services that drive repeat purchases and increased spending over time.
The UAE’s commitment to digital transformation, underscored by initiatives like the UAE AI Strategy 2031, emphasises the role of AI in creating meaningful customer interactions. With the local AI-driven retail market poised for substantial growth, personalisation has become essential for boosting customer retention, satisfaction, and revenue. By aligning with these forward-thinking strategies, businesses can deliver optimised experiences and unlock greater lifetime value from their customer base.
How can businesses effectively measure the ROI of AI-driven personalization?
To evaluate the return on investment (ROI) of AI-driven personalisation, it's essential to start with clear, measurable objectives. These should directly connect to your business goals, such as boosting conversion rates, increasing customer lifetime value (CLV), or enhancing engagement metrics like click-through rates (CTR). Define what success means for your organisation and ensure these targets align with your broader strategy.
Next, compare personalised experiences to a baseline or control group to gauge their actual impact. Track both leading indicators - like CTR, engagement levels, and time spent on your site - and lagging indicators, such as revenue growth and customer retention. Tools like A/B testing and consistent attribution models are particularly useful for validating the results of your personalisation efforts.
Lastly, focus on measuring the incremental lift, which represents the success directly linked to personalisation. By following these steps, businesses can refine their strategies, justify their investments, and clearly showcase the value that AI-driven personalisation brings to achieving consistent growth.
What is the role of control groups in measuring the success of AI personalization efforts?
Control groups are essential for assessing how effective AI-powered personalisation strategies truly are. By comparing the behaviour of users who receive tailored content with those who only see generic or non-personalised content, businesses can measure the real impact of their personalisation efforts.
This method helps pinpoint actual benefits - like improved conversion rates or higher revenue per visitor - while filtering out external influences such as seasonal changes or shifts in the market. Leveraging control groups ensures decisions are based on solid data, confirms the success of AI-driven personalisation, and offers actionable insights to refine future campaigns.