
Blog / How Mobile Apps Collect User Behavior Data
How Mobile Apps Collect User Behavior Data
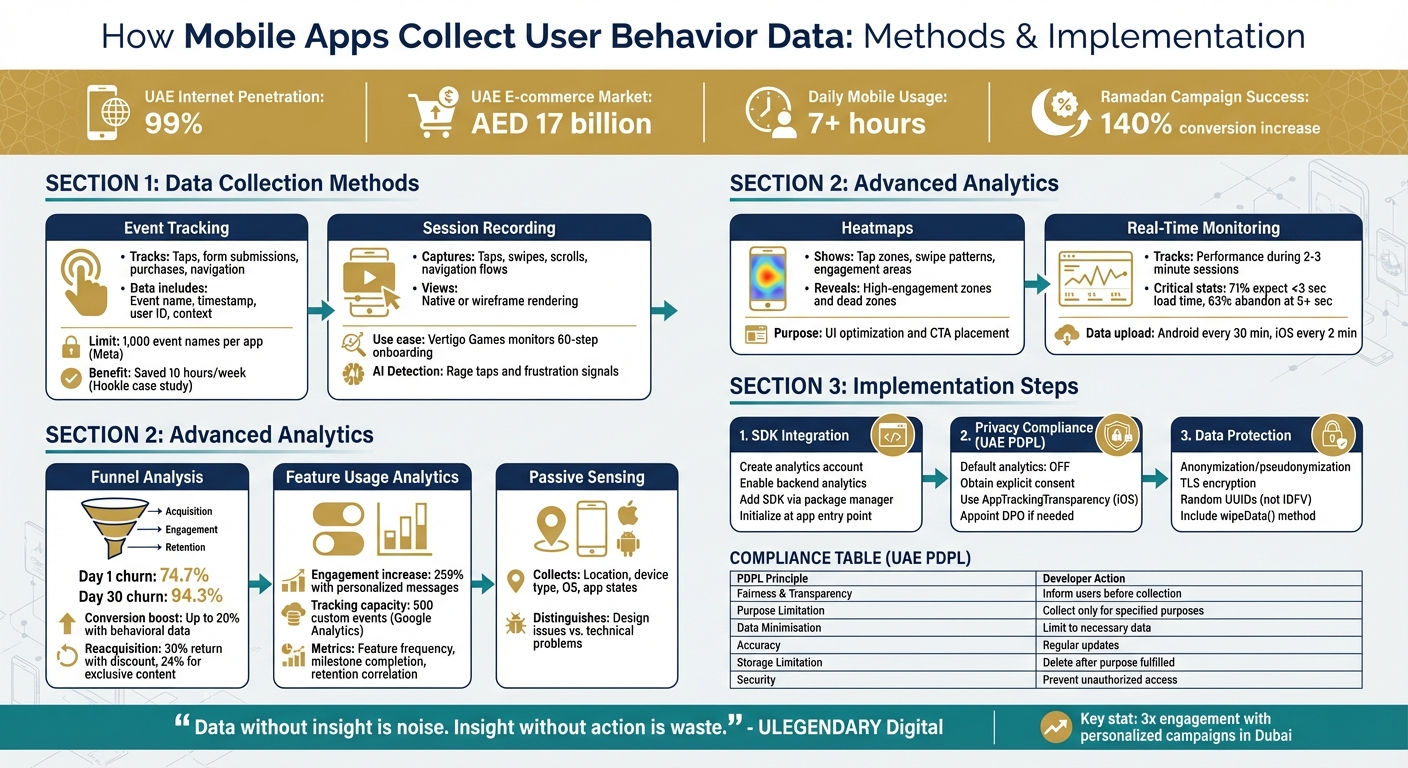
Mobile apps track every tap, swipe, and scroll to understand user actions, preferences, and frustrations. This data helps businesses improve app performance, target users effectively, and personalise experiences. In the UAE, with 99% internet penetration and a thriving AED 17 billion e-commerce market, understanding user behaviour is essential. Companies use tools like event tracking, session recording, and heatmaps to refine user journeys, fix technical issues, and boost engagement. For example, targeted push notifications during Ramadan increased conversions by 140%. By leveraging analytics responsibly and adhering to UAE privacy laws, businesses can improve app usability and user retention while respecting data protection regulations.
Mobile App User Behavior Data Collection Methods and Implementation Guide
Mobile app analytics best practices: 5 proven tips to track, analyze & grow your app
sbb-itb-058f46d
Methods of Collecting User Behavior Data
Mobile apps rely on tools like event tracking, session recording, and heatmaps to gather insights into user behavior. These methods use integrated SDKs to log interactions and send data in batches to analytics servers, which helps conserve battery life. For example, Android devices typically upload data every 30 minutes, while iOS devices do so every 2 minutes. Let’s break down these methods and how they contribute to understanding user behavior.
Event Tracking
Event tracking focuses on monitoring specific user actions within an app - things like tapping a button, submitting a form, making a purchase, or navigating between screens. Each event includes details such as a name (e.g., "Add to Cart"), timestamp, user ID, and optional context like product details or prices in AED. Developers can automate the tracking of common actions or manually tag key events, such as "Subscription Purchased", to highlight important milestones. A combined approach is often used, with SDKs handling broader trends while developers define critical business events.
"Event tracking is a fundamental aspect of modern marketing and analytics that allows businesses to monitor and analyse specific actions or occurrences (events) within their digital properties." – MoEngage
Take Hookle, a social media management app, as an example. By using event tracking alongside session recordings, their team saved around 10 hours per week in identifying and resolving bugs. When implementing event tracking, it’s essential to focus on actions that reflect user intent or progress toward conversions. Platforms like Meta App Events cap event names at 1,000 per app, which encourages teams to prioritise meaningful interactions. A well-organised tracking plan ensures consistent data collection across platforms.
While event tracking helps quantify user actions, session recordings add rich context to these numbers.
Session Recording
Session recording goes beyond tracking individual actions by visually capturing how users interact with an app. This method creates replay-like videos of real user sessions, showing taps, swipes, scrolls, and navigation flows. It’s a powerful way to uncover usability issues - like a button hidden by a keyboard or a loading spinner that frustrates users.
The process uses a lightweight SDK to collect anonymised data without affecting app performance. Recordings can be rendered as either native or wireframe views, balancing clarity with user privacy.
"We are now able to see how our customers use our mobile app, which helps us find bugs more quickly as well as validate design very quickly." – Eric K., Verified User
For instance, Vertigo Games uses session recordings to monitor a lengthy 60-step onboarding process. By identifying where users drop off, they’ve been able to refine the experience and improve retention rates. To manage data, recordings can be filtered by events or device types. Advanced tools even use AI to flag frustration signals, like repeated taps on an unresponsive element (rage taps), helping teams quickly address issues. Session recordings bridge the gap between raw metrics and actionable insights.
Heatmaps
Heatmaps offer a visual way to understand user engagement by showing where people tap, swipe, or focus their attention most within an app. By compiling thousands of interactions into one visual summary, heatmaps highlight high-engagement areas and reveal "dead zones" with little activity. These insights are invaluable for improving user interface (UI) design and optimising the placement of key elements like call-to-action buttons.
Advanced User Behavior Analytics
Taking user tracking to the next level, advanced analytics hones in on where users drop off and enables on-the-spot personalisation.
Funnel and Conversion Tracking
Funnel analysis breaks down the user journey into clear steps, guiding users toward goals like purchases, onboarding completion, or subscriptions. By tracking each stage, you can identify where users abandon the process and tackle those trouble spots.
This approach combines numbers (like drop-off rates) with insights into user behaviour. For example, thorough funnel analysis can uncover problems before they escalate into support issues.
"Funnel analysis is a great way to tackle this challenge as it helps identify these drop-off points and allows you to optimise entire user journeys." – Ashley Bhalerao, Associate Manager of Content, VWO
Start by outlining key events for each lifecycle stage - Acquisition (e.g., installs), Engagement (e.g., onboarding), and Retention (e.g., repeat purchases). Work backward from your ultimate goal, like "Purchase Completed", and map out the steps leading there. Advanced tracking can also segment funnels by device, operating system, or user type to pinpoint whether the issues are technical bugs or design flaws. For example, tracking behaviours like "rage clicks" (frustrated tapping) or JavaScript errors can highlight specific technical blockers. Once you identify a bottleneck, test solutions like shorter forms or one-click sign-ups through A/B testing to see what works best.
The numbers emphasise the importance of this method: mobile apps see an average churn rate of 74.7% on Day 1, rising to 94.3% by Day 30. Apps that use behavioural data can boost conversion rates by up to 20%. Reacquisition efforts also show promise - 30% of users may return with a discount offer, and 24% for exclusive content.
Next, we’ll dive into how analysing feature usage expands your insight into user engagement beyond just conversions.
Feature Usage Analytics
Knowing which features users engage with - and which they ignore - can guide your product updates and help you allocate resources wisely. Feature usage analytics tracks actions that show value, like how often features are used or when users hit milestones (e.g., "project shared" or "report generated").
The goal is to link feature usage to retention. By analysing which in-app activities lead to long-term engagement, you can make informed updates. For instance, high short-term usage but low long-term retention might indicate that a feature lacks ongoing value. In one case, businesses saw a 259% increase in engagement when they sent personalised messages based on users’ in-app behaviours and demographics instead of generic content.
"One of the best features... is its ability to... track product features and page usage. This functionality allows us to gather insightful data, enabling us to understand user behaviour, identify pain points, and continuously improve our product based on real user interactions." – Jatin K., Digital Adoption Professional, ServiceNow
To dig deeper, use event parameters to capture details like feature variants or user attributes. For example, Google Analytics supports unlimited reporting on up to 500 custom events to track specific business goals. Break the user journey into stages (Acquisition, Onboarding, Activation, Retention) and assign trackable events to each, identifying where engagement drops off. Retention tables can help analyse how many users continue using a feature after trying it on Day 0. Look for signs of frustration, like repeated backtracking or task abandonment, to spot design issues. Use these insights to trigger targeted messages, such as tips for advanced users or reminders for those who haven’t explored key features yet.
Real-Time User Monitoring and Passive Sensing
Real-time monitoring provides instant insights into user behaviour and app performance, which is especially useful during short interactions (2–3 minutes). Without this immediate tracking, brief sessions - and the problems within them - could go unnoticed.
Session replays allow development teams to see how bugs occur from the user’s point of view. Passive sensing collects data like location, device type, and operating system to clarify the user’s environment. This helps distinguish between design issues (e.g., confusing layouts) and technical problems (e.g., slow load times), so teams don’t misinterpret user behaviour.
"Having access to relevant session replays lets dev and QA teams see how each bug occurred from a users' point of view, instead of guessing what went wrong." – Pavel Kroh, Smartlook Team
Technical performance is critical: 71% of users expect an app to load within 3 seconds, and 63% will abandon it if it takes longer than 5 seconds. Advanced tools can also track app states in real time, such as "cold starts" versus "background resumes", to better understand how users return to the app.
Link session recordings to specific user identifiers (like email or username) so support teams can quickly review the exact session tied to a bug report. Tracking micro-actions, such as swipes or backtracking, can also reveal where users lose momentum. Use wireframe rendering modes to monitor interactions while protecting sensitive data like passwords. Lastly, compare performance across platforms (e.g., iOS vs. Android) to identify any UI inconsistencies or bugs specific to certain devices.
Implementing In-App Analytics
Setting up effective in-app analytics involves selecting the right tools, adhering to legal standards, and responsibly managing user data.
SDK Integration
Software Development Kits (SDKs) simplify data collection by offering pre-built functions. Here’s how to integrate one effectively:
- Start with account setup: Create an account and property in your chosen analytics platform.
- Enable analytics in your backend: For example, use Firebase to activate analytics features.
- Add the SDK: Use a platform-specific package manager like Swift Package Manager or CocoaPods for iOS, or the Firebase JS SDK for web apps.
Once integrated, initialise the SDK at your app’s entry point (e.g., FirebaseApp.configure()). This setup enables automatic event tracking, such as first_open, while allowing you to log custom events using methods like logEvent. For instance, Google Analytics supports up to 500 unique custom events per app. Use debugging tools like DebugView or launch arguments (e.g., -FIRAnalyticsDebugEnabled) to confirm that event tracking works during development.
To optimise performance, adjust dispatch intervals based on your app’s needs. This ensures you balance data freshness with device efficiency. Keep in mind that if a user uninstalls and reinstalls your app, the SDK will generate a new anonymous identifier, categorising them as a "new user."
With the SDK installed, the next critical step is ensuring your app complies with UAE privacy laws.
Compliance with Data Privacy Laws
After integrating the SDK, it’s vital to align with UAE’s data privacy regulations. The UAE’s Federal Decree Law No. 45 of 2021 (PDPL), effective from 2 January 2022, sets strict rules for collecting and processing personal data. User consent is mandatory unless processing is required for public interest or legal obligations. You must clearly inform users about the data you collect, why it’s collected, and who will receive it.
"It is prohibited to process Personal Data without the consent of its owner." – Federal Decree Law No. 45 of 2021
To comply, set default analytics flags (e.g., FIREBASE_ANALYTICS_COLLECTION_ENABLED) to NO in your app’s configuration file. Activate data collection only after users give explicit consent. For iOS apps, if tracking extends across other companies’ apps or websites, use Apple’s AppTrackingTransparency (ATT) framework to request permission. Additionally, disclose all third-party code, including analytics SDKs, in the App Store’s "Privacy Nutrition Labels."
Protect user identities by applying anonymisation or pseudonymisation techniques. For example, instead of requesting precise GPS data, derive general location information from masked IP addresses unless absolutely necessary. If your app handles large amounts of sensitive data or involves extensive profiling, appoint a Data Protection Officer (DPO) and conduct a Data Protection Impact Assessment (DPIA) before deploying new analytics features. Keep a detailed record of your data collection practices, including access logs and security measures, as UAE regulators may request this information.
| PDPL Control (Article 5) | Developer Requirement |
|---|---|
| Fairness & Transparency | Clearly inform users about data collection before starting. |
| Purpose Limitation | Collect data only for specified purposes and avoid unrelated uses. |
| Data Minimisation | Limit data collection to what’s necessary for analytics. |
| Accuracy | Ensure data is correct and regularly updated. |
| Storage Limitation | Delete data after its purpose is fulfilled unless anonymised. |
| Security | Implement measures to prevent unauthorised access or breaches. |
By following these guidelines, you’ll not only meet legal standards but also build user trust. Partnering with a digital strategies expert can further refine your approach to data-driven growth.
Best Practices for Data Collection
Responsible data collection is essential for maintaining user trust. Include visible toggles in your app settings, such as "Disable Tracking" and "Resume Tracking", to give users control. Avoid tying app functionality to tracking consent or offering incentives for agreeing to tracking. Use clear, straightforward prompts to explain why data is collected.
Encrypt all user data collected by Google Analytics for Firebase using Transport Layer Security (TLS). Switch to randomly generated UUIDs for device identification instead of relying on the Identifier for Vendors (IDFV) to improve privacy. Avoid fingerprinting techniques - such as using device configurations or network data to identify users - as this can lead to App Store rejection. Include a wipeData() method to allow users to delete all client-side data stored by your app.
Fine-tune data dispatch intervals to balance performance and data freshness. Starting with iOS 17.2, Apple restricts declared tracking endpoints until users approve the ATT prompt. Always respect system-level permissions and avoid misleading users into granting access.
Conclusion
Mobile app data collection offers more than just numbers - it provides a window into user behaviour and helps craft better experiences. Techniques like event tracking, session recording, heatmaps, and funnel analysis uncover where users engage, where they encounter obstacles, and what keeps them coming back. In the UAE, with its impressive 99% internet penetration and users spending over 7 hours daily on mobile devices, businesses that tap into this wealth of data gain a clear advantage.
"Data without insight is noise. Insight without action is waste." – ULEGENDARY Digital
These insights pave the way for strategies that elevate app performance. For instance, UAE businesses can use predictive analytics to anticipate demand surges during Ramadan, implement hyper-personalised experiences that seamlessly switch between Arabic and English, or pinpoint issues causing higher bounce rates on localised checkout pages. In Dubai, personalised marketing campaigns have shown to achieve three times the engagement compared to generic broadcasts. Across the region, data-driven decision-making has replaced intuition as the standard for success in the competitive digital market.
Wick's Four Pillar Framework takes this a step further by transforming raw data into focused, actionable strategies. The Capture & Store pillar equips businesses with tools for detailed data analysis and customer journey mapping. The Tailor & Automate pillar then uses these insights to deliver AI-powered personalisation and automated marketing, ensuring every interaction feels relevant and contextual. This integrated method aligns efforts across website development, content creation, and social media, creating a connected digital ecosystem designed to drive consistent growth.
FAQs
What user actions should my app track first?
Tracking key user actions such as button clicks, page views, sign-ups, and purchases is crucial for understanding user behaviour. These events shed light on how users interact with your app, offering insights into their preferences and engagement patterns. By focusing on these metrics, you can make informed decisions to improve user experience and drive better results.
How can I use session recordings without capturing sensitive data?
To ensure the safe use of session recordings, it's crucial to configure privacy controls that mask or omit sensitive information before any recording begins. Use filters in your analytics tools to automatically conceal fields containing personal identifiers, passwords, or other confidential data. This approach not only helps you stay compliant with data protection regulations but also respects user privacy while allowing you to gather meaningful insights from the recordings.
How do I stay PDPL-compliant when collecting in-app analytics in the UAE?
To comply with the UAE Personal Data Protection Law (PDPL), it's crucial to handle data responsibly. This means obtaining clear user consent, adhering strictly to the PDPL's requirements, and putting strong security measures in place to protect personal data. Equally important is respecting user rights by being transparent about how data is collected, used, and stored, while following the law's specific rules for data management.