
Blog / Building a Customer Churn Early Warning System
Building a Customer Churn Early Warning System
Customer churn impacts revenue, retention, and growth - especially in the UAE's competitive market. This article explains how to predict and prevent churn using data, analytics, and machine learning. Here's what you need to know:
- Churn Definition: Customers stop engaging, cancel subscriptions, or fail payments.
- Why It Matters: Losing customers increases costs - acquiring one new customer can cost as much as retaining three.
- Solution: A churn early warning system uses data to predict at-risk customers so businesses can act proactively.
- Key Steps:
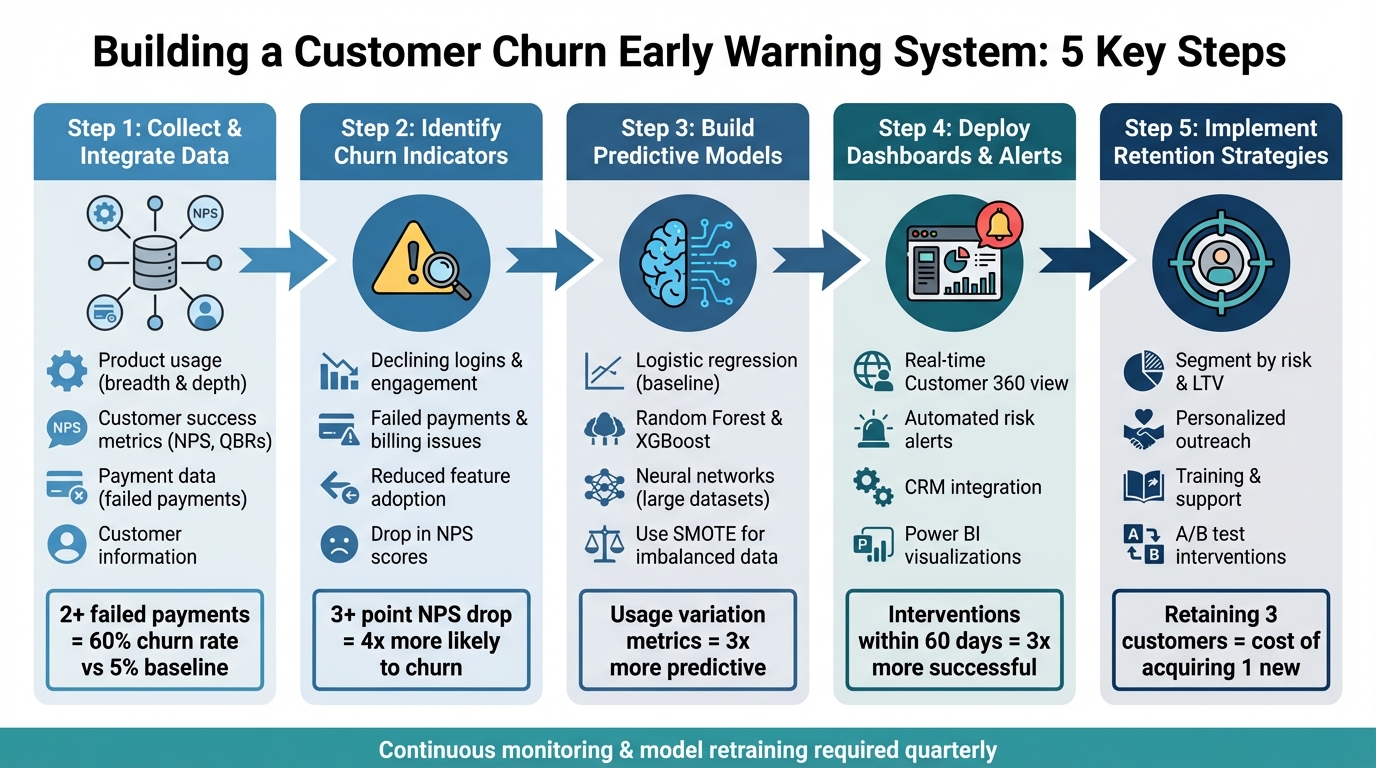
- Collect and integrate data (product usage, payments, customer success).
- Identify churn indicators (e.g., declining logins, failed payments).
- Build predictive models with machine learning.
- Deploy dashboards and alerts for real-time action.
- Implement retention strategies tailored to customer risk levels.
5-Step Customer Churn Early Warning System Implementation Process
Gathering and Understanding Key Data Sources
Types of Data to Collect
Creating an effective churn prediction system begins with gathering the right kind of data. You’ll want to categorise this information into four main areas: Customer Information, Product Usage, Customer Success, and Payment Data.
When it comes to product usage, focus on both breadth (how many features are being used) and depth (the frequency or volume of core actions). Interestingly, tracking variations - like comparing 7-day averages to 30-day averages - can be up to three times more predictive than relying on single-point metrics. For instance, on platforms like Slack, teams whose message volume drops below a specific threshold are five times more likely to churn compared to active teams.
Customer Success data offers insights into how healthy the relationship with your customers is. Declining participation in activities like Quarterly Business Reviews (QBRs), webinars, or community forums often signals a reduction in product usage. One particularly telling metric is the Net Promoter Score (NPS) - a drop of three or more points in a single quarter makes a customer four times more likely to churn. Payment data is another critical area; in subscription-based businesses, customers with two or more failed payments have a 60% churn rate, compared to a baseline of just 5%.
Data Integration Best Practices
Once you’ve pinpointed the data you need, the next step is integrating it effectively. The cornerstone of this process is identity resolution - linking account-level and user-level IDs across various systems like billing, product usage, and customer success data to build a cohesive customer profile. Without this step, it becomes difficult to connect related activities, such as a support ticket tied to declining usage.
Centralising this data is essential. Use a unified platform - like a data lake or Unified-CXM system - to consolidate information for a complete customer view. Before analysis, preprocess the data by addressing missing values, removing duplicates, and standardising numerical formats. To handle imbalanced datasets (where churners are outnumbered by non-churners), techniques like SMOTE (Synthetic Minority Oversampling Technique) can help improve prediction accuracy.
It’s also important to comply with UAE data protection regulations. This includes anonymising sensitive data, obtaining explicit consent for its use, and implementing role-based access controls so only authorised personnel can access customer details.
Integrated data systems often face technical and quality-related hurdles, so it’s crucial to anticipate these challenges early.
Common Data Collection Challenges
One of the biggest challenges is data silos - customer data being scattered across different systems like CRMs, support desks, billing platforms, and social media. Each department may use different formats, making integration a technical headache. Platforms such as Microsoft Fabric or Snowflake can help by centralising data storage into one unified system.
Another issue is incomplete or inaccurate data, which can weaken the reliability of predictions. Watch for "silent churners" - customers who disengage without raising complaints - since these subtle signals are often overlooked.
Customer behaviour can shift over time, making it essential to keep models up to date. Schedule regular monitoring and retrain your model at least every quarter to reflect these changes. Acting quickly is key - interventions carried out within the first 60 days are three times more likely to succeed than those initiated with less than 30 days remaining. By prioritising speed and maintaining high data quality, you’ll set the stage for developing predictive features that truly make a difference.
Designing Predictive Features and Health Scores
Key Churn Indicators
Once your data is integrated, the next step is identifying the signals that hint at customer churn. Start with product usage metrics - these are the backbone of your analysis. Look at things like logins, session durations, seat adoption, and how users interact with various features. For B2B customers, firmographic details like company size, industry, or tech stack can be crucial. For B2C, focus on demographic factors such as age, profession, or location.
Financial patterns often act as red flags. Watch for payment failures, billing disputes, subscription downgrades, or shifts in purchase frequency. Customer success metrics, like Net Promoter Score (NPS), Customer Satisfaction (CSAT) scores, and the volume of support tickets, provide insight into how customers perceive your service. On top of that, engagement signals - such as interactions with marketing emails, newsletters, community forums, or even the removal of product integrations - can highlight early disengagement.
To make raw data actionable, convert it into digestible metrics. For example, aggregate log data into totals (e.g., monthly logins) or track behaviour changes over time (e.g., a percentage drop in usage over 30 days). Time-to-value metrics, which measure how quickly users achieve milestones after onboarding, can also be revealing. Normalising numerical data into a standard range ensures that metrics like AED 5,000 in spend and five logins are compared fairly. These engineered metrics form the foundation for evaluating churn detection methods.
Comparison of Detection Methods
Not all churn indicators are created equal, and each requires a tailored detection method. Here's how they stack up:
| Churn Indicator | Detection Method | Impact Level | Primary Data Source |
|---|---|---|---|
| Declining Product Usage | Usage Tracking / Trend Analysis | High | Product Analytics (e.g., Mixpanel, Amplitude) |
| Payment Failures | Automated Billing Monitoring | Medium (Involuntary) | Payment Processor (e.g., Stripe) |
| Increased Support Tickets | Sentiment Analysis / Ticket Counting | Medium to High | Helpdesk/CRM (e.g., Zendesk, Salesforce) |
| Integration Uninstalls | Event Trigger Monitoring | High | System Logs / API Usage |
| Low NPS/CSAT Scores | Survey Feedback Analysis | High | Customer Success Tools |
| Marketing Disengagement | Email Open/Click Tracking | Low to Medium | Marketing Automation (e.g., HubSpot) |
Some signals, like integration uninstalls or the departure of key team members in a workspace, carry more weight than a simple dip in login frequency. Understanding these nuances helps you prioritise which signals demand immediate action.
Creating a Customer Health Score
A customer health score consolidates various metrics into a single measure to gauge retention risk. Start by segmenting your customers. Enterprise clients and SMBs often have distinct usage patterns and contract terms, so their scoring logic should differ. A typical health score might weigh product usage (40%), customer success (30%), payment data (20%), and customer metadata (10%).
"Predicting churn requires the identification of key signals, using historical churn insights, and utilising AI-driven predictive models." - UserMotion
To build the score, use specific time frames to measure behavioural shifts - for instance, compare the last 30 days of usage to the previous 90-day average. Normalise all metrics to a consistent scale before applying weights. Then, calculate the final score by multiplying each metric by its weight and summing the results.
Finally, refine your scoring model by creating a feedback loop. Track the outcomes of your retention efforts and feed that data back into the system to improve accuracy over time.
Building and Deploying the Churn Prediction Model
Choosing the Right Model
The choice of model depends heavily on the complexity of your data and the specific goals of your business. For industries like finance, where transparency is crucial, logistic regression is often the go-to option. It's straightforward, easy to implement, and provides clear insights into why customers might churn - perfect for creating a baseline model.
If you're dealing with larger datasets that include a wide variety of variables, ensemble methods like Random Forest and Gradient Boosting often deliver better accuracy. Random Forest combines multiple decision trees to minimise overfitting and improve reliability. Gradient Boosting methods, including XGBoost and LightGBM, are excellent at identifying intricate patterns in data but demand more computational resources and careful tuning. For organisations handling massive datasets, neural networks can be effective, though their "black box" nature makes it harder to pinpoint the exact factors driving churn.
A good strategy is to start with a logistic regression model to identify key factors influencing churn. Once you’ve built a foundation, you can move on to ensemble methods for more precise predictions. For datasets where churn cases are rare, techniques like SMOTE (Synthetic Minority Oversampling Technique) can help balance the data. Use evaluation metrics like AUPRC, F1-score, or AUC-ROC to measure performance.
Training the Model with Time-Based Splits
To avoid data leakage, it’s essential to use time-based splits instead of shuffling data randomly. Train your model on older data and test it on the most recent period.
Organise behavioural data into time windows, such as activity over the past 7 days versus the previous 90 days, to capture trends like declining engagement. Focus on identifying features that strongly predict churn - such as login frequency, support interactions, or payment issues - and use these insights to fine-tune your retention strategies.
Regular retraining is key to keeping your model relevant. Tools like MLflow or DVC can help ensure reproducibility and streamline updates. These practices not only improve your model’s accuracy but also enable real-time insights for decision-making.
Deploying Real-Time Dashboards and Alerts
Integrating your churn prediction model into a CRM or marketing platform can transform how you address customer retention. When a customer's health score crosses a high-risk threshold, the system should trigger immediate alerts or launch automated workflows.
Develop dashboards that provide a full "Customer 360" view. These dashboards should go beyond just displaying a churn score - they should also highlight the specific factors contributing to a customer's risk. Tools like Power BI can visualise churn trends across different dimensions, such as product categories, regions, or customer segments.
Set up automated alerts to notify account managers whenever a churn signal arises. This could be triggered by events like a failed transaction, an increase in support tickets, or the removal of an integration. Additionally, integrating with payment systems can help you identify and address involuntary churn. By segmenting customers based on their risk levels, you can implement targeted interventions and track the outcomes to continuously refine your model.
sbb-itb-058f46d
Implementing Retention Interventions
Segmenting Customers by Risk Levels
Once your churn prediction model is up and running, the next logical step is segmenting customers based on their risk of leaving and their overall value to your business. This segmentation is crucial because high-risk, high-value customers demand immediate, tailored attention, while lower-value groups can often be handled with automated campaigns.
To get started, compare churn risk with customer lifetime value (LTV). For instance, a customer with a 70% risk of leaving and an LTV of AED 50,000 requires a very different approach than one with the same risk but an LTV of AED 2,000. Beyond basic demographics, focus on behavioural patterns - like login frequency, feature usage, and integration trends. A sharp drop in engagement (e.g., more than 30% month-over-month) is a clear signal that intervention is needed.
You can take this a step further by segmenting high-risk customers according to the specific reasons they might churn. Some may face technical challenges, others might feel they’re not getting enough value, and some could find pricing a barrier. By addressing these unique pain points with customised retention strategies, you’re far more likely to resolve the root causes of dissatisfaction than with generic solutions.
| Segmentation Category | Key Data Points & Signals | Prioritisation Logic |
|---|---|---|
| Behavioural | Login frequency, feature adoption, session duration, integration uninstalls | High risk if usage drops >30% |
| Customer Success | NPS scores, CSAT, support ticket volume, lack of response to emails | High risk if sentiment is negative or communication stops |
| Financial | Payment failures, subscription downgrades, upcoming renewal dates | Immediate risk if payment fails or plan is downgraded |
| Demographic | Company size, industry, geography, tech stack | Segment by LTV |
Retention Strategies That Work
Actively engage with at-risk customers by leveraging real-time analytics to trigger personalised actions. For example, if a customer’s login activity drops significantly over two weeks, send them a customised check-in email to understand their experience with the product. This kind of outreach not only builds trust but also helps you address issues before they escalate.
Keep an eye on whether customers are hitting important usage milestones. If they’re falling short, offer additional training, resources, or technical support to help them get more value from your product. For customers who are price-sensitive, consider providing discounts or flexible payment options. Use uplift modelling to identify those who are likely to stay only if offered specific incentives.
"Churn prediction is simply identifying the signals of churn before it really happens." – UserMotion
Another essential tactic is providing multi-channel support. While AI-driven chatbots are great for handling routine questions around the clock, complex issues should be escalated to human agents, especially when dealing with high-risk customers. Additionally, creating a sense of community - through exclusive forums or user groups - can make your product feel more indispensable and encourage stronger engagement.
Monitoring Outcomes and Refining the Model
Once your retention strategies are in place, it’s vital to track their effectiveness. Set up feedback loops to capture the results of your efforts - whether a personalised offer prevented a cancellation or a training session improved feature adoption - and use this data to refine your churn model over time.
A/B testing is a great way to measure the impact of your strategies. Compare churn rates between groups that received interventions and those that didn’t to see what’s working. Monitor key retention metrics weekly to catch any negative trends early, and investigate whether these are due to bugs, seasonal factors, or broader issues.
"The true test of the model's effectiveness is its impact on business metrics. Are you able to reduce churn rates by acting on the model's predictions?" – Stripe
Keep in mind that continuous model retraining is critical. As you gather more data on which customers stayed and which didn’t, feed this information back into your AI systems to help them adapt to changing patterns. Adjust model parameters and refine customer features based on what you learn from your interventions to improve accuracy. Also, be prepared to adapt your model to external factors - like economic shifts or seasonal trends - that might disrupt typical customer behaviour.
Conclusion and Next Steps
Key Takeaways
A churn early warning system is all about staying ahead of customer loss by constantly collecting, analysing, and refining data. The first step? Clearly define what churn means for your business. It could be something like a subscription cancellation or a specific period of inactivity. Once that's clear, gather detailed data on both churned and active customers, clean it thoroughly, and create features that truly reflect their behaviours. Then, select a machine learning model that matches your data's complexity, validate it rigorously, and set it up to provide real-time alerts for swift action.
But here's the thing: predicting churn is just the beginning. The real impact comes from using these predictions to drive segmented, personalised retention strategies. Use A/B testing to monitor results and keep retraining your model as customer behaviours shift over time. This approach isn’t just about identifying risks - it’s about creating opportunities for targeted, meaningful interventions.
How Wick Can Help

Wick combines data analytics, marketing automation, and AI-powered personalisation to build churn prediction systems that deliver real results. With its Four Pillar Framework, Wick doesn’t just help you predict churn - it helps you prevent it. The Capture & Store pillar uses data analytics and customer journey mapping to pinpoint at-risk customers. Meanwhile, the Tailor & Automate pillar deploys marketing automation and personalisation strategies to deliver the right interventions at the perfect moment.
Whether you need help with CDP implementation, performance tracking dashboards, or strategic consulting to sharpen your retention strategy, Wick ensures every element works seamlessly together to drive sustainable growth.
Call to Action
Take control of customer retention today. Visit Wick to learn how the Four Pillar Framework can transform your approach to churn prevention. Schedule a consultation and discover how our data-driven solutions can keep you one step ahead.
Customer Churn Prediction Using Machine Learning – Full Python Data Science Project!
FAQs
What is a customer churn early warning system, and how can it help businesses in the UAE?
A customer churn early warning system helps businesses in the UAE anticipate when customers might stop using their services or cancel subscriptions. By examining behavioural and transactional data, the system picks up on patterns that could indicate potential churn. These patterns might include things like reduced engagement, late payments, or even negative feedback.
The system relies on tools like predictive analytics or machine learning to keep an eye on customer interactions. When it spots someone at risk, it sends an alert, giving businesses a chance to act quickly. This could mean offering personalised incentives, addressing service issues, or simply reaching out to re-engage the customer.
For businesses in the UAE, tailoring this system to the local market is key. Adjusting for local preferences, respecting cultural nuances, and using AED-based offers can make a big difference. These thoughtful customisations not only improve retention but also help build stronger, lasting relationships in the region's fast-moving digital economy.
What data should I focus on to predict customer churn effectively?
To get ahead of customer churn, it's essential to dig into a few important data categories:
- Customer details: Look at demographics, preferences, and how they've interacted with your brand so far.
- Product usage: Track how often they use your product, for how long, and any noticeable patterns in their engagement.
- Customer support data: Analyse their feedback, complaints, and satisfaction ratings to spot any red flags.
- Payment information: Keep an eye on missed payments, downgrades, or cancellations - they're often early signs of churn.
By closely examining these areas, you can better understand customer behaviour and step in before it's too late.
Which machine learning models work best for predicting customer churn?
To create a reliable system for predicting customer churn, businesses often rely on classification models. Popular options include logistic regression, decision trees, random forests, and gradient boosting machines. These tools examine past customer behaviour to uncover patterns that signal a potential for churn.
Using these insights, companies can take preemptive steps to minimise churn and enhance their retention efforts. However, for the best outcomes, it's crucial to customise the model to align with your unique data and business requirements.