
Blog / BigQuery for SEO: Visualizing Content Analytics
BigQuery for SEO: Visualizing Content Analytics
BigQuery solves the biggest challenges in SEO analytics: data limits, sampling, and short retention periods. Unlike Search Console (1,000 rows) or GA4 (sampling after 500,000 sessions), BigQuery processes massive datasets - up to petabytes - without sampling, offering unsampled GA4 and Search Console data. This allows UAE businesses to store data indefinitely, track year-over-year trends, and build a complete SEO archive.
Here’s why BigQuery is a game-changer for SEO:
- Unlimited Historical Data: Store Search Console data beyond the 16-month cap.
- Custom Queries: Use SQL to analyse content pathways, keyword opportunities, and user engagement.
- Data Integration: Combine GA4, Search Console, CRM, and server logs into one source.
- Free Tier: 10 GB storage and 1 TB query processing monthly.
BigQuery also supports advanced analytics like machine learning (predict traffic trends) and cohort analysis (track user behaviour over time). Using tools like Looker Studio or Google Sheets, you can visualise your insights, making it easier to optimise your content strategy.
For UAE businesses managing millions of pages, BigQuery simplifies SEO analytics by offering precise, actionable insights that standard tools can't match.
BigQuery 101for SEOs to use Google Search Console data - Paulo Andraus - brightonSEO September 2023
Setting Up BigQuery for SEO Data Analysis
BigQuery SEO Setup: Complete Configuration Guide for GA4 and Search Console Integration
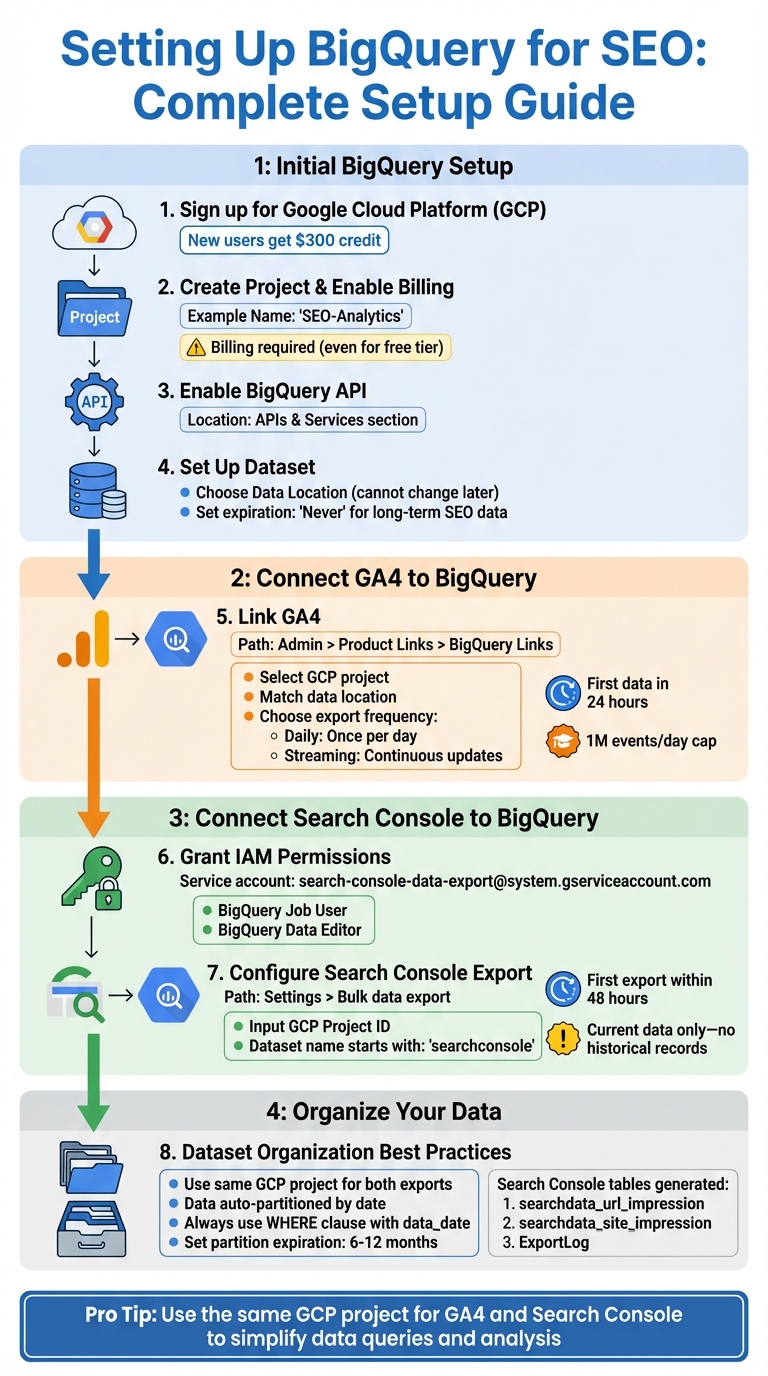
To start, sign up for a Google Cloud Platform (GCP) account. New users receive a $300 credit to explore its features.
- Create a project and enable billing: Give your project a name, such as 'SEO-Analytics'. Billing must be enabled, even if you plan to operate within the free tier.
- Enable the BigQuery API: Head to the 'APIs & Services' section and activate the BigQuery API.
- Set up a dataset for your SEO data: Choose an appropriate Data Location, as this cannot be changed later. For long-term SEO analysis, set the data expiration to "Never" to retain rankings and traffic data indefinitely.
Connecting Google Analytics and Search Console to BigQuery
Linking Google Analytics 4 (GA4) to BigQuery is straightforward. Go to your GA4 property and navigate to Admin > Product Links > BigQuery Links. Select your GCP project, match the data location with your dataset settings, and pick an export frequency - either Daily (once a day) or Streaming (continuous updates). The first data export typically appears within 24 hours, though GA4 properties have a daily export cap of 1 million events.
For Search Console, grant the service account search-console-data-export@system.gserviceaccount.com the roles of BigQuery Job User and BigQuery Data Editor in your GCP IAM settings. Then, in Search Console, go to Settings > Bulk data export, input your GCP Project ID, and assign a dataset name starting with searchconsole. The initial export occurs within 48 hours and includes only current data - no historical records.
"The first export will happen up to 48 hours after your successful configuration in Search Console. The first export includes data for the day of the export." – Google Search Console Help
For simplicity, use the same GCP project for both GA4 and Search Console exports. This approach makes it easier to combine datasets later when querying search and user engagement data. Additionally, data usage typically stays well within the free storage limits.
Organizing Your BigQuery Datasets for SEO
Proper dataset organisation is crucial for efficient queries and cost control. BigQuery automatically partitions data by date, so your queries only process the specific date ranges you define. Always include a WHERE clause that filters by data_date or _TABLE_SUFFIX to minimise the data processed.
Search Console exports generate three standard tables: searchdata_url_impression, searchdata_site_impression, and ExportLog. If you manage multiple properties, assign unique dataset names with the searchconsole_ prefix to keep them distinct within the same project.
Set partition expiration times - typically 6 to 12 months - to manage storage costs without deleting entire datasets. For perspective, BigQuery can handle petabytes of data, which is about 50 million times the capacity of a single Google Sheet. With this immense scale, careful organisation is key to maintaining efficiency.
Once your datasets are structured, you’re ready to dive into querying and visualising your SEO metrics.
Key BigQuery SQL Queries for Content Analytics
Once your datasets are ready, you can dive into SQL queries to uncover patterns that standard reports might miss. BigQuery excels at handling massive datasets and combining information from multiple sources - capabilities that far exceed the limits of the Search Console UI (1,000 rows) and API (50,000 rows). By using GROUP BY and aggregation functions, you can consolidate data effectively.
Analysing Top-Performing Content Pages
To identify which pages are driving traffic and engagement, you can run this query to extract metrics like pageviews, average time on page, and bounce rate for your top 100 pages:
SELECT
  page_path,
  SUM(pageviews) AS total_pageviews,
  AVG(avg_time_on_page) AS average_time_on_page,
  SUM(bounces)/SUM(entrances) AS bounce_rate
FROM `project.dataset.ga_sessions_*`
WHERE _TABLE_SUFFIX BETWEEN '20250101' AND '20250131'
GROUP BY page_path
ORDER BY total_pageviews DESC
LIMIT 100;
The WHERE _TABLE_SUFFIX clause is key - it filters by date range, which not only keeps your query efficient but also reduces costs when working with partitioned tables. The bounce rate is calculated as SUM(bounces)/SUM(entrances), providing the percentage of single-page sessions.
Finding Keyword Opportunities
By joining data from Search Console and GA4, you can pinpoint keywords with high potential - those with high impressions but low clicks or high clicks but poor conversion rates. Use REGEXP_REPLACE to standardise URLs for better analysis.
"The most powerful way to export performance data is the bulk data export to BigQuery, where you can get the biggest amount of data." – Daniel Waisberg, Search Advocate, Google
For calculating average position, use this formula: (SUM(sum_top_position) / SUM(impressions)) + 1. To avoid skewed results, filter out anonymised queries by adding WHERE query != ''. This ensures you're focusing on meaningful keywords that can drive real business value, not just traffic.
Measuring Content Engagement by Category
Organise URLs into categories using CASE statements to understand how different types of content resonate with your audience:
SELECT
  CASE
    WHEN url LIKE '%/blog/%' THEN 'Blog'
    WHEN url LIKE '%/product/%' THEN 'Product'
    WHEN url LIKE '%/help/%' THEN 'Help'
    ELSE 'Other'
  END AS url_group,
  COUNT(DISTINCT url) AS total_urls,
  SUM(clicks) AS total_clicks,
  SUM(impressions) AS total_impressions
FROM
  `searchconsole.searchdata_url_impression`
WHERE
  data_date BETWEEN DATE_SUB(CURRENT_DATE(), INTERVAL 28 DAY) AND CURRENT_DATE()
GROUP BY url_group
ORDER BY total_clicks DESC;
For deeper insights, combine this data with GA4 metrics like average session duration and conversion rates per category. For example, in August 2024, SEO specialist Precious Chindongo Thundu developed a model that segmented metrics such as pageviews, avg_bounce_rate, and total_conversions by traffic source and content title. This approach helps marketers see whether specific blog posts perform better through organic search or social media. Such insights can guide decisions on reallocating promotion budgets to the most effective channels for each content type.
| Analysis Goal | Key SQL Metrics | Source Table(s) |
|---|---|---|
| Top Content Performance | pageviews, avg_bounce_rate, total_conversions |
GA4 events_* |
| Keyword Opportunities | query, impressions, clicks, CTR, avg_position |
GSC searchdata_url_impression |
| Traffic Source Value | traffic_source, sessions, conversion_rate |
GA4 events_* |
| SEO-GA4 Integration | query, landing_page, unique_sessions, purchase_value |
GSC + GA4 (Joined) |
For precise, page-level analysis, use searchdata_url_impression instead of searchdata_site_impression, which aggregates data at the property level. This level of detail is crucial for measuring how specific content categories perform.
These SQL queries not only provide actionable insights but also lay the groundwork for creating impactful data visualisations.
Visualising SEO Data with BigQuery Integrations
Turning SQL query results into visual representations can transform raw data into meaningful insights for SEO. By leveraging tools like Looker Studio and Google Sheets, you can create visual dashboards that highlight trends, opportunities, and actionable data points.
Building SEO Dashboards in Looker Studio

Looker Studio provides several ways to connect with BigQuery: selecting a specific table or view, writing a custom SQL query, or using the "Explore in Looker Studio" option directly from the BigQuery console. For SEO purposes, date-partitioned tables are particularly handy, enabling you to filter data by precise date ranges. This is especially useful for analysing seasonal content trends or measuring the impact of specific campaigns over time.
When working with Google Analytics BigQuery Export tables, Looker Studio enhances the data by adding key metrics automatically. For more advanced SEO analyses, the Custom Query option allows you to write Standard SQL, enabling you to filter or combine datasets before they are visualised. For example, you could merge Search Console data with GA4 conversion metrics to pinpoint which keywords not only drive traffic but also lead to tangible business results.
"Using BigQuery will open many possibilities in data processing and visualisation." – Daniel Waisberg, Advocate, Search Relations, and Gaal Yahas, Software Engineer, Search Console
Looker Studio also offers interactive cross-filtering, allowing you to select a dimension in one chart and have it automatically filter related charts. Additionally, you can review SQL details to fine-tune insights and manage costs. Keep in mind that Looker Studio can handle up to 2 million rows of data, so using LIMIT clauses and date filters wisely is essential. For larger dashboards, enabling BigQuery BI Engine can help improve loading speeds and cut down on compute costs.
These features make Looker Studio a powerful companion to BigQuery analytics, helping you craft a cohesive, data-driven SEO strategy. For simpler, quicker visualisations, Google Sheets is another excellent option.
Using Google Sheets for Quick Data Visualisations
Google Sheets offers a straightforward way to visualise data without the need for complex dashboard setups. With its native BigQuery connector, you can query data directly within the spreadsheet, creating pivot tables and charts without exporting data manually. This approach is ideal for sharing quick insights with stakeholders who may not be familiar with BigQuery or Looker Studio.
By scheduling data refreshes, you can keep metrics like keyword performance and top-performing pages up to date without manual effort. When experimenting with new queries, including a LIMIT clause can help preview results and manage dataset size efficiently. Plus, BigQuery’s free tier - 10 GB of storage and 1 TB of query processing per month - makes this a cost-effective option for smaller teams or initial experiments. For ongoing analyses, Google Sheets can also be linked as an external data source in BigQuery, allowing you to query spreadsheet data alongside other datasets using SQL.
| Connection Method | Setup Ease | Flexibility | Best SEO Use Case |
|---|---|---|---|
| Table/View Connection | High (Point-and-click) | Limited to existing schema | Standard GA4/GSC exports |
| Custom SQL Connection | Moderate (Requires SQL) | High (Joins, transformations) | Complex attribution or multi-source joins |
| Google Sheets Connector | High (Familiar interface) | Moderate (Pivot tables) | Quick collaborative analysis |
sbb-itb-058f46d
Advanced Techniques for Content Analytics with BigQuery
Once you've got the hang of basic queries and visualisations in BigQuery, it's time to step up your game. These advanced techniques can take your SEO strategy to the next level. They don’t just help you see which content performs well - they reveal why users engage with it and how they navigate your site over time.
Performing Cohort Analysis for Content Journeys
Cohort analysis is all about grouping users by shared traits - like the date of their first visit or the type of content they landed on - and tracking their behaviour over time. For SEO, this means you can trace user journeys from their initial organic landing page all the way to conversion points.
To define cohorts, use SQL's FIRST_VALUE function, partitioned by user_id, and calculate retention with DATE_DIFF. Then, build a retention matrix with CASE statements to see how many users return after certain intervals - Day 0, Day 1, Day 7, Day 30. This gives you a clear view of which content categories keep users coming back.
"By comparing the behavior and retention of different cohorts, you can gain insights into how user engagement and loyalty evolve over time, identify factors that contribute to long-term retention, and make data-driven decisions to optimize the user experience." – Murray Cole
Cohort analysis also helps with funnel tracking. You can see how specific groups move through key milestones - like landing page to newsletter signup to purchase - and pinpoint where organic traffic drops off. By segmenting cohorts based on acquisition channel (organic search versus social), device type, or entry page category, you can identify which segments perform well and which ones might need attention.
For recurring seasonal analyses, you can improve efficiency by using materialised views, which reduce query costs and processing time.
Using Materialised Views for Seasonal Trends
Analysing seasonal content trends often means working with data from multiple years. But running complex queries repeatedly can drive up costs and slow things down. This is where materialised views come in - they cache query results and automatically update as new data comes in. If you're tracking year-over-year trends - like holiday shopping guides or seasonal service pages - this method is a game-changer for speed and cost efficiency.
When setting up a materialised view for seasonal analysis, partition it by the same date column as your base table. This ensures that only the relevant partitions refresh when data changes, avoiding the need to reprocess the entire dataset. BigQuery's smart tuning feature automatically rewrites queries to use materialised views when they fit your query pattern. You can also use the max_staleness option to define acceptable data lag, such as one hour, which works perfectly for seasonal reporting where real-time updates aren't critical.
Materialised views are particularly useful for pre-aggregating data, like calculating average position or total clicks by content category. When joining multiple tables - like Search Console and GA4 data - place the largest or most frequently updated table on the leftmost side to maintain incremental refresh capabilities. Keep in mind, though, that functions like CURRENT_DATE() aren't supported in materialised views, and you'll incur costs for both storage and the bytes processed during automatic refreshes.
"The most powerful way to export performance data is the bulk data export to BigQuery, where you can get the biggest amount of data." – Daniel Waisberg, Advocate, Search Relations, Google
Since Google Search Console only keeps detailed data for 16 months, BigQuery's unlimited historical storage is essential for meaningful year-over-year comparisons. By combining materialised views with clustering on key columns - like content category or region - you can filter and analyse specific seasonal patterns with minimal query overhead.
Applying BigQuery Insights with Wick's Four Pillar Framework
By combining BigQuery with Wick's Four Pillar Framework, raw data transforms into actionable SEO strategies. This approach moves beyond chasing high-volume keywords, instead focusing on solving customer-specific problems with content that attracts high-quality, converting traffic.
Capture & Store: BigQuery for Data Analytics
In the Capture & Store pillar of Wick's framework, BigQuery acts as the ultimate data hub, gathering all your raw SEO data in one place. Unlike standard tools, it provides unsampled, unlimited historical data, offering a clear and complete picture of your performance.
The real advantage lies in its ability to track key performance metrics with precision. By using SQL, you can pinpoint organic pathways that take users from landing pages to conversions. This goes beyond generic traffic reports - you're tracking Key Event Rates across specific content categories, helping you identify which pages drive measurable business results. For UAE-based businesses managing millions of URLs, this scalability is a game-changer, especially when traditional tools like Excel can’t handle the load.
Plan & Promote: Data-Driven Content Optimisation
BigQuery insights elevate the Plan & Promote pillar by shifting the focus to user-centric content. Instead of asking, "What keywords have the highest search volume?" you're uncovering, "What problems are high-intent users trying to solve?". This method helps identify search gaps - opportunities where your content can address real user needs, even if keyword tools show low search volume.
BigQuery categorises queries into groups like "Brand", "New vs. Lost", and "Question-based", offering a structured approach to content promotion. By integrating Google Search Console (GSC) data with GA4 and CRM systems, you can track which queries lead to actual conversions - not just clicks.
Automate your process by scheduling daily queries, ensuring Looker Studio dashboards always display up-to-date SEO performance. To keep costs down and maintain speed, avoid linking reporting tools directly to raw BigQuery tables. Instead, transform, filter, and partition your data before running queries. With Google Cloud Platform's free tier offering 10 GB of storage and 1 TB of query processing per month, UAE businesses can start harnessing these insights without hefty upfront costs, paving the way for smarter, data-driven content strategies.
Conclusion
BigQuery has revolutionised SEO by turning it into a truly data-driven discipline. With access to raw, unsampled data, it allows you to see the complete picture of your content's performance - something that standard tools often fail to deliver.
These capabilities combine to create a powerful resource for refining and improving your content strategies.
"BigQuery is the only way to fully unlock and connect your GA4 and GSC raw data... It's a complete shift in how you find, measure, and double down on high-intent content that actually drives sales."
– David Koay, Intent-Topics SEO Marketer
When it comes to high-intent content strategies, the ability to process millions of queries and identify the pages that truly convert is essential. BigQuery excels at this, offering fast and precise insights from massive datasets. For UAE businesses managing extensive websites, where traditional tools like Excel simply can't keep up, BigQuery is an indispensable solution. Plus, with Google Cloud Platform's free tier offering 10 GB of storage and 1 TB of query processing each month, it’s easier than ever to get started.
As discussed earlier, pairing BigQuery with Wick's Four Pillar Framework transforms raw analytics into actionable SEO strategies. This integration makes BigQuery more than just a data warehouse - it becomes a cornerstone for long-term growth. Whether it's capturing unsampled historical data or automating daily insights for content optimisation, this approach ensures your SEO efforts stay aligned with your business goals.
Don’t wait to integrate GSC and GA4 with BigQuery. Remember, these tools don’t backfill historical data, so any delay could mean losing critical insights. Start now and turn your raw data into strategies that address customer needs and deliver tangible business outcomes.
FAQs
How does BigQuery manage data limits and sampling compared to GA4 and Search Console?
BigQuery stands out by enabling the processing of large datasets without resorting to sampling. This ensures a more thorough and precise analysis compared to tools like GA4 and Search Console, which often rely on sampling methods that can restrict the depth and accuracy of the data.
For SEO and content analytics, this capability is especially beneficial. By working with complete datasets, businesses can uncover deeper insights and make decisions based on a full picture of their data.
How can I connect GA4 and Search Console to BigQuery for data analysis?
To link GA4 and Search Console with BigQuery, begin by utilising the BigQuery Data Transfer Service to set up automated transfers of GA4 data. For Search Console, go to the settings to enable bulk data export or configure daily exports directly through the interface. This integration helps you centralise your analytics data in BigQuery, making it easier to gain deeper insights and simplify reporting.
How can BigQuery help me find the right keywords for SEO?
BigQuery offers a practical way to dig into keyword opportunities. By exporting and analysing data from Google Search Console, you can pinpoint keywords that have high impressions but relatively low clicks. These are often hidden gems - keywords that could benefit from better optimisation to drive more traffic.
You can take it a step further by blending this information with other datasets, like website analytics or competitor data. This combination helps you identify content gaps and fine-tune your SEO strategy. The result? A sharper focus on keywords that resonate with your audience and boost your website's visibility in search rankings.